I'd go with ListPointPlot3D.
ListPoint3D generates a 3D scattered plot of points with coordinates {xi,yi,zi}.
Since you're a bit avaricious with your data, here the plot with your data:
data = {{51, 15, 0.1}, {300, 11, 0.99}, {140, 22, 0.123}, {54, 12, 0.66}};
ListPointPlot3D[data, PlotStyle -> PointSize[0.03], Filling -> Bottom,
   ViewPoint -> {0, 0, \[Infinity]}]

Edit:
If you want to use BSpline, just take a BSplineCurve, if your data does not produce a decent surface:
Graphics3D[{BSplineCurve[data], PointSize[Medium], Green, Line[data],
    Red, Point[data]}, BoxRatios -> {2, 2, 2}]

Edit2:
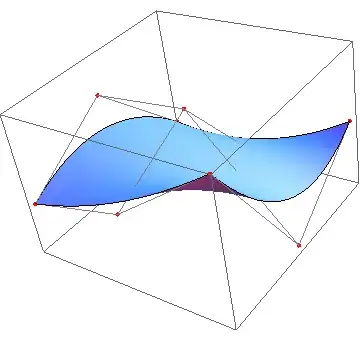
For a BSplineSurface (with qualified data) you can do something like:
data=Table[{i, j, RandomReal[{-1, 1}]}, {i, 3}, {j, 3}];
Show[Graphics3D[{PointSize[Medium], Red, Map[Point, data], Gray,
    Line[data], Line[Transpose[data]]}], Graphics3D[BSplineSurface[data]]]

ListPlot3D? – m_goldberg Jun 18 '13 at 05:57Interpolationworks for multidimensional functions but You have to be sure that there are no duplicates in {x,y} with different z.Interpolation[{{#1, #2}, #3} & @@@ data]– Kuba Jun 18 '13 at 06:07