In general my question is related to an approach to make an interpolation of a data which is not on a regular mesh. Another aspect of this question has already been discussed after my question "Numerical integration of a numeric data available as a nested list".
I have data in the form of a list of triads {x, y, z} that came from an external simulation. It may be and may be not ordered. Further, x and y lie within a rectangle R, and are not regularly spaced. I would like to coarse-grain and simultaneously sort this data. The coarse-graining consists in partitioning the rectangle R into multiple small rectangles and constructing a list {xij, yij, zij} where xij and yij are the coordinates of the centers of the rectangles, while zij is the average of all z values for which x and y belong to the rectangle specified by i and j. To be specific, let us build a list mimicking the real one, but small enough:
a = RandomReal[{0, 10}, {10000, 2}];
b = RandomReal[{-1, 1}, {10000}];
lst =
  MapThread[Insert[#1, #2, 3] &, {a, b}] /.
   {x_, y_, z_} -> {x, y, 10 Exp[-((x - 5)^2 + (y - 5)^2)/4] + z};
The list lst has 10000 elements with x and y located between 0 and 10. The coarse-grained list may be obtained by the averaging over squares with the sizes 0.5*0.5 like this:
lstCoarseGrained = Flatten[Table[
    (s = Select[
       lst, ((i <= #[[1]] <= i + 0.5) && (j <= #[[2]] <= j + 0.5) &)];
      {{i + 0.25, j + 0.25}, Mean[Transpose[s][[3]]]}),
    {i, 0, 9.75, 0.5}, {j, 0, 9.75, 0.5}], 1];
It has
Length[lstCoarseGrained]
400
elements and can be straightforwardly interpolated:
f = Interpolation[lstCoarseGrained, InterpolationOrder -> 3, Method -> "Spline"]
plotted:
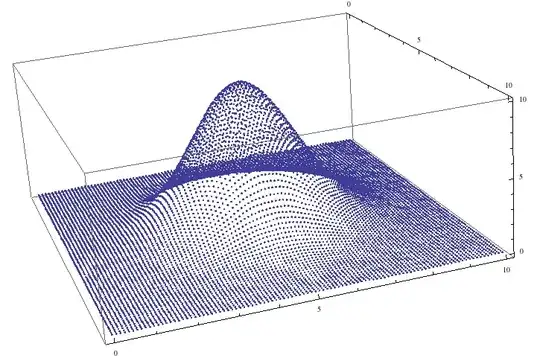
Row[{
  ListPlot3D[lst, PlotRange -> All, ImageSize -> 250],
  Plot3D[f[x, y], {x, 0, 10}, {y, 0, 10}, PlotRange -> All, ImageSize -> 250]
}]

and then further post-processed. On the figure above the left image shows the data before, and the right - after the coarse-graining and interpolation.
However, the coarse-graining by this approach requires
Timing[
  Flatten[
    Table[
      (
        s = Select[lst, ((i <= #[[1]] <= i + 0.5) && (j <= #[[2]] <= j + 0.5) &)];
        {{i + 0.25, j + 0.25}, Mean[Transpose[s][[3]]]}
      ),
      {i, 0, 9.75, 0.5}, {j, 0, 9.75, 0.5}],
    1];]
{13.468750, Null}
13 seconds. My realistic lists have about 10^6 triads and will require about 21 min.
My question is, if you can see a faster way to do this?
In principle, if I could, say, use something like Partition instead of a Table, it would go faster. However, to do this, the list should be first sorted in 2D, and I do not see, how. So the second question is if you see the way to sort the list with elements {x,y,z} with arbitrary order in the (x,y) plane such that it is organized as like, say, the list given by the table:
Table[{i, j}, {i, 1, 5}, {j, 1, 5}]
lst, you should use:>(RuleDelayed) rather than->(Rule). A (faster) alternative here isMapThread[Append[#1,10 Exp[-((#1[[1]]-5)^2+(#[[2]]-5)^2)/4]+#2]&,{a,b}]. Just to show you that we haveAppendhere rather thanInsert[_,_,3], I realize is not the step you want to optimize. – Jacob Akkerboom Jun 20 '13 at 11:28