I'm having some difficulties with the command StreamPlot in Mathematica 7.0.
Here's the basic plots I'm doing :
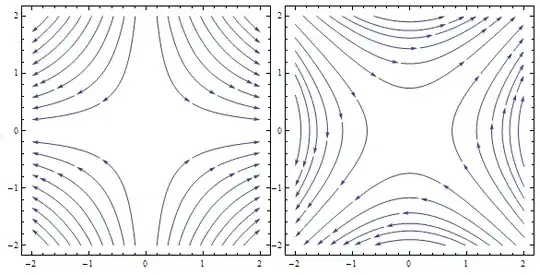
StreamPlot[{x, -y}, {x, -2, 2}, {y, -2, 2}, Axes -> True,
AxesOrigin -> {0, 0}, FrameTicks -> None,
StreamPoints -> 12, StreamScale -> 0.15, PerformanceGoal -> "Quality"]

StreamPlot[{y, x}, {x, -2, 2}, {y, -2, 2}, Axes -> True,
AxesOrigin -> {0, 0}, FrameTicks -> None, StreamPoints -> 12,
StreamScale -> 0.15, PerformanceGoal -> "Quality"]
Here's the output, which I find ugly :

How can I define the number of arrows heads to be drawn on each curve? Currently, there are too many arrows on the curves. I would prefer a maximum of two (or maybe three) arrows per stream curve.
How can I make the output perfectly symetric? Look for example at the second picture, which is terrible.
How can I remove the straight stream lines?

StreamPointsexplicitly to get rid of the straight lines. This could also be the solution to your symmetry problem. FWIW, this is perfectly symmetric by default on Mathematica 9. – Corey Kelly Jun 20 '13 at 15:24StreamPointsif they are too close to each other. This is addressed in the question How to get StreamPlot to draw many hundreds of streamlines? – Jens Jun 20 '13 at 17:13