14

Bug fixed in version 13.2.0 or earlier


Several Graphics primitives are listable. For instance, Point accepts lists of coordinates so that multiple calls to Point are often unnecessary.

The results are the same, except for one thing I noticed while working on the eye fixation question, yesterday.

pts = RandomReal[10, {30, 2}];  
pl1 = Graphics[Point@pts];    (* single Point function call    *)
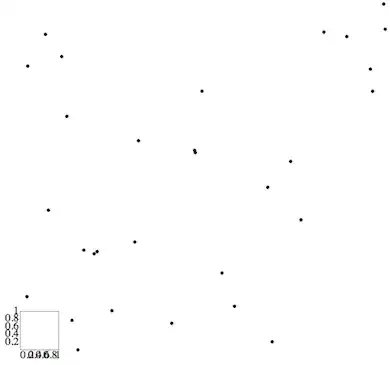
pl2 = Graphics[Point /@ pts]; (* multiple Point function calls *)

GraphicsRow[{pl1, pl2}, Frame -> All]

Mathematica graphics

The difference lies in the effect on PlotRange. Whereas a list of Points yields a PlotRange of:

AbsoluteOptions[pl2, PlotRange]

(* ==> {PlotRange -> {{0.493385472, 9.588596333}, {0.2849334536, 9.012342799}}} *)

using the multi-Point syntax gives:

AbsoluteOptions[pl1, PlotRange]

(* ==> {PlotRange -> {{0., 1.}, {0., 1.}}} *)

The Get Coordinates tool gets the same coordinates in both figures.

The question is: is there any good reason for the PlotRange reported in pl1 or is this a bug?

bmf
  • 15,157
  • 2
  • 26
  • 63
Sjoerd C. de Vries
  • 65,815
  • 14
  • 188
  • 323
  • It's half the extents of the min-max of the individual points... not sure why though. – rm -rf Mar 08 '12 at 22:59
  • @r.m The points lie in a range of 0-10. What do you mean with individual min- max extent? – Sjoerd C. de Vries Mar 08 '12 at 23:02
  • 1
    Graphics plots each point (if you plotted one by one) such that it is centered in the entire plot. So if you do it individually and calculate the PlotRange for each, then I would expect that if you Show[] all of them, the plot range would span the minimum and maximum among all the individual ones. So far this is good. However, what you see is exactly half of that. I can't explain for this factor of 2 though. Try: xylims = (Last /@ FullOptions[Graphics[Point@#], PlotRange] &) /@ pts; Through[{Min, Max}@#] & /@ (xylims\[Transpose]). This final number is twice the plot range for pl2 – rm -rf Mar 08 '12 at 23:09
  • 6
    It's a bug, that has been reported once or twice already. – Brett Champion Mar 09 '12 at 03:57
  • 1
    Using Complement[Union[FullOptions[pl2], FullOptions[pl1]], Intersection[FullOptions[pl2], FullOptions[pl1]]] you find there are additional options that differ between pl1 and pl2:AspectRatio,AxesOrigin, and Ticks. – kglr Mar 09 '12 at 04:25
  • @BrettChampion I wasn't aware of that. Was it reported here or on SO? – Sjoerd C. de Vries Mar 09 '12 at 06:30
  • @Sjoerd In an email response today, Wolfram confirmed that the 3D analogue in my answer is a known bug. – Jens Mar 19 '12 at 18:29
  • @jens Good to know. Any clue as to when a fix will be around? – Sjoerd C. de Vries Mar 19 '12 at 20:28
  • @Sjoerd not really - the developers are "working on finding a solution," i.e.: don't call us, we'll call you. – Jens Mar 19 '12 at 20:38
  • @jens Anyway, so it's not AbsoluteOptions as you surmised in your answer. If you could modify it a bit to include this information I'll accept your answer – Sjoerd C. de Vries Mar 19 '12 at 20:47
  • Actually, it is AbsoluteOptions because the bug report I sent to Mathematica was all about how AbsoluteOptions gives the wrong result with or without using the listablility of Sphere. My statement in the bug report was: "AbsoluteOptions doesn't work properly" and they confirmed it. – Jens Mar 19 '12 at 20:58
  • @Jens In that case... – Sjoerd C. de Vries Mar 19 '12 at 20:59
  • @SjoerdC.deVries The bug is still present in 11.0.1. Do you recall for which version you reported it? I guess 8.0 but perhaps with an earlier version? –  Oct 16 '16 at 13:08
  • @Xavier it was jens who reported it. – Sjoerd C. de Vries Oct 16 '16 at 13:14

1 Answers1

11

I'm tempted to blame this on AbsoluteOptions, because it is known to be buggy (I filed a bug report on it in January). I also tried the following

FullGraphics@Show[pl1, Frame -> True]

Frame mismatched

which shows that the incorrect PlotRange value is in fact used internally, making this a pretty significant bug.

I would suggest filing a bug report blaming it on AbsoluteOptions (it's just a guess, but hey - we don't have the source code...)

Update

I think the case against AbsoluteOptions is becoming stronger with the following tests. That means, I'm now pretty confident that the issue in this question is not inherent to the argument-list version of Point.

Consider the three-dimensional version of the question, with

pts = RandomReal[10, {30, 3}];
pl1 = Graphics3D[Point@pts];
pl2 = Graphics3D[Point /@ pts];

The results of AbsoluteOptions[pl1, PlotRange] and AbsoluteOptions[pl2, PlotRange] show the same discrepancy as in the 2D case.

If I now replace the 3D points by spheres, I can use the same two methods of feeding it the points:

sph1 = Graphics3D[Sphere[pts, .05]];
sph2 = Graphics3D[Sphere[#, .05] & /@ pts];

However, the results of

AbsoluteOptions[sph1, PlotRange]

and

AbsoluteOptions[sph2, PlotRange]

now both show the incorrect result {PlotRange -> {{0., 1.}, {0., 1.}, {0., 1.}}}. What I would infer from this is that it is not the listability property itself that is causing a wrong PlotRange calculation. Note: I say "infer" - not "conclude", because it's not conclusive...

Update 2

For completeness, I sent a bug report to Wolfram in which I gave these examples and stated that AbsoluteOptions doesn't work properly here. Wolfram support confirmed the bug.

Jens
  • 97,245
  • 7
  • 213
  • 499