3

I have a set of data of the kind {{$x_i$, $y_i$, $z_i$}, ...} at randomly chosen points $x_i, y_i$.

The $z_i$ are supposed to be a smooth function of the $x_i$ and $y_i$. Unfortunately they turn out not to be. A few points stick out. These are local extrema - I want to find them and remove them from the data set.

The problem is that the $x_i$ and $y_i$ are chosen randomly, so I cannot choose nearest neighbors for comparison easily. Are there any methods to find the nearest neighbors in a given list, or even directly to find the local maxima in a random grid?

Neuneck
  • 665
  • 4
  • 17
  • 3
    One possibility would be to construct the Delaunay triangulation ( = find nearest neighbours), then pick those $(x,y)$ points which have a higher $z$ value than all of their neighbours. Check the ComputationalGeometry package for Delaunay triangulation. – Szabolcs Jun 24 '13 at 07:46
  • Other way is to create Median filter. http://en.wikipedia.org/wiki/Median_filter – Kuba Jun 24 '13 at 07:54

2 Answers2

3

The idea is to construct the Delaunay triangulation and get the points that have higher values than all of their neighbours (according to this triangulation).

Here's a worked example:

Generate the sample data:

f[x_, y_] := Sin[x] Sin[y]
points = RandomReal[{-3, 3}, {300, 2}];

zval = f @@@ points;

Find the local maxima:

<< ComputationalGeometry`
tri = DelaunayTriangulation[points];
tests = And @@ Thread[zval[[#1]] > zval[[#2]]] & @@@ tri
maxima = Pick[points, tests]

(* ==> {{1.3437, 1.68432}, {2.75095, -2.69678}, {-2.97601, 1.98261}, {-1.57433, -1.57115}} *)

(For your noisy data you might want to use a stricter criterion than just "larger than all neighbours", e.g. larger by a threshold. Also, for simplicity I used the slow ComputationalGeometry package but you'll probably want something faster.)

Visualize them:

ListDensityPlot[ArrayFlatten[{{points, List /@ zval}}], 
 Epilog -> {Red, PointSize[Large], Point[maxima]}]

enter image description here

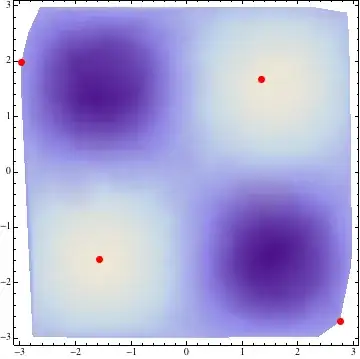
Two of them are on the convex hull. You can filter those out:

Complement[maxima, points[[ConvexHull[points]]]]

(* ==> {{-1.57433, -1.57115}, {1.3437, 1.68432}} *)

(Note: it would have been better to filter these based on the indexes of points rather than the coordinates to avoid unnecessary floating point comparisons, but I was lazy :)

Szabolcs
  • 234,956
  • 30
  • 623
  • 1,263
2

An alternative way (notice usage of Nearest in case of random distributed points):

pts = Table[RandomReal[{0, 2 Pi}], {1000}, {2}];
data = {##, Sin[#1] Cos[#2]} & @@@ pts;
(*and some noise*)
dev = Table[{RandomReal[{0, 2 Pi}], RandomReal[{0, 2 Pi}], RandomReal[{2, 5}]}, {20}];
data = data~Join~dev;
ListDensityPlot[data]

enter image description here

set = Thread[data[[ ;; , ;; 2]] -> data[[ ;; , 3]]];
dane = With[{k = 1, med = Median@Nearest[set, {#1, #2}, 10]}, 
    If[Abs[(#3 - med)] > k, {#1, #2, med}, {##}]] & @@@ data;

ListDensityPlot[dane]

enter image description here

You can change If[Abs[(#3 - med)] > k and k, it depends what do You want, and what do You know about deviations.

Kuba
  • 136,707
  • 13
  • 279
  • 740