Since I don't find an way to modify the Tics orientation, I use a zero length for the Tics and put my custom marks as Epilog.
xmin = 0; xmax = 7.5;
ymin = -1; ymax = 1;
txl = 0.1; txr = \[Pi]/4; txg = 1.5;
tyl = 0.1; tyr = 0; tyg = .5;
(*length, rotation and gap for x and y ticks*)
tic = {Table[ Line[{{tx, 0}, {tx + txl*Cos[txr], txl*Sin[txr]}}], {tx, xmin, xmax, txg}], Table[Line[{{0, ty}, {tyl*Cos[tyr], ty + tyl*Sin[tyr]}}], {ty, ymin, ymax, tyg}]};
(*creating the marks*)
ticlabel = {Table[{tx, tx, 0}, {tx, xmin, xmax, txg}], Table[{ty, ty, 0}, {ty, ymin, ymax, tyg}]};
(*you can choose any tick label here - it is the second element of the tables*)
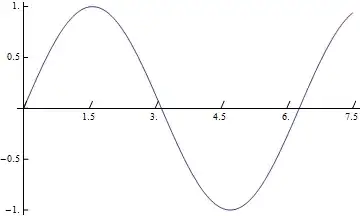
Plot[Sin[x], {x, xmin, xmax}, Ticks -> ticlabel, Epilog -> tic]
And this is how it looks.
For 3D
Thanks @Jens for pointing out. For 3D one can go with same prescription. Here instead of Epilog lets use Graphics3D for creating the tics and Show to combine it with the main plot.
xmin = 0; xmax = 7.5;
ymin = -1; ymax = 2;
zmin = -1; zmax = 1;
txl = 0.2; txr =3 \[Pi]/4; txg = 1.5;
txy = ymin; txz = zmin; (*y and z position for x tics*)
tyl = 0.2; tyr = 0; tyg = .5;
tyz = zmin; tyx = xmax;
tzl = 0.2; tzr = 0; tzg = .5;
tzx = xmin; tzy = ymin;
(*length,rotation and gap for x, y and z ticks*)
(*you can add two rotation angles as well for each tick*)
tic = {Table[Line[{{tx, txy, txz}, {tx + txl*Cos[txr], txl*Sin[txr] + txy,txz}}], {tx, xmin, xmax, txg}],
Table[Line[{{tyx, ty, tyz}, {tyl*Cos[tyr] + tyx, ty + tyl*Sin[tyr],tyz}}], {ty, ymin, ymax, tyg}],
Table[Line[{{tzx, tzy, tz}, {tzl + tzx, tzy, tz}}], {tz, zmin, zmax, tzg}]};
(*creating the marks*)
ticlabel = {Table[{tx, tx, 0}, {tx, xmin, xmax, txg}],
Table[{ty, ty, 0}, {ty, ymin, ymax, tyg}],
Table[{tz, tz, 0}, {tz, zmin, zmax, tzg}]};
(*you can choose any tick label here-it is the second element of the tables*)
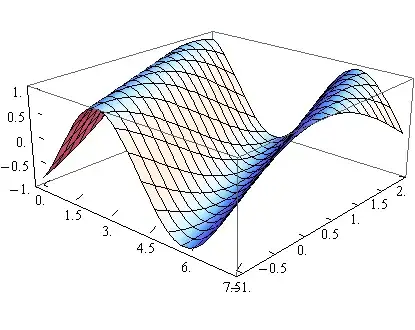
Show[Plot3D[Sin[x + y], {x, xmin, xmax}, {y, ymin, ymax},Ticks -> ticlabel], Graphics3D[tic]]
And the output is
You can go with Graphics + Show combination for 2D also.