10

I built a Graph based on the permutations of city's connections from :

largUSCities = 
Select[CityData[{All, "USA"}], CityData[#, "Population"] > 600000 &];
uScityCoords = CityData[#, "Coordinates"] & /@ largUSCities;
Graph[#[[1]] -> #[[2]] & /@ Permutations[largUSCities, {2}] , 
VertexCoordinates -> Reverse[uScityCoords, 2], VertexStyle -> Red, 
Prolog -> {LightBrown, CountryData["USA", "FullPolygon"]},ImageSize -> 650]

It looks like this: graph

My question, is there any way to have the Graph like this? enter image description here

J. M.'s missing motivation
  • 124,525
  • 11
  • 401
  • 574
Alex
  • 1,235
  • 8
  • 23
  • 1
    Bottom graph is most populus city in each state. Then there is a pruning algorithm to reduce the number of edges. – Fred Daniel Kline Jul 12 '13 at 10:26
  • @FredKline could you please help in writing algorithm? – Alex Jul 12 '13 at 10:30
  • Imagine a light-house with its revolving light at each city. When the light hits another city, draw the line, unless that line crosses another. The bottom graph has no crossing lines. (i.e., it's planar.) That's the best I can do to help. – Fred Daniel Kline Jul 12 '13 at 10:42
  • 2
    @FredKline "Bottom graph is most populus city in each state." — I don't think so, because for CA, it's somewhere in NorCal instead of stinkin' LA ;) – rm -rf Jul 12 '13 at 15:23
  • @rm-rf YES .it is just center of state from (W+E)/2 and (N+S)/2 here – Alex Jul 12 '13 at 15:25
  • Also, not Chicago in IL. – s0rce Jul 12 '13 at 16:15
  • @rm-rf, I assumed that since he is selecting cities by population, and if he wanted one point in each state, then the resultant graph would have the most populus city of each state as the location of its vertex. I had used this approach on the travelling salesman problem 30-years ago (without any more success than the other methods.) – Fred Daniel Kline Jul 12 '13 at 19:58

5 Answers5

9

Revised answer

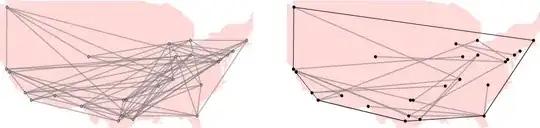
This uses the connectivity between states to create the graph, and uses the coordinates of the center of each state rather than the cities. I couldn't find a way to get these easily from Mathematica or from WolframAlpha (I'm no Harry Potter, and failed to discover the correct incantation for the latter). But I found a table somewhere:

stateConnections = {{"NV", "CA", "AZ", "UT", "ID", "OR"}, {"OR", "CA",
     "NV", "ID", "WA"}, {"TX", "OK", "LA", "NM", "AR"}, {"DC", "VA", 
    "MD"}, {"FL", "GA", "AL"}, {"RI", "MA", "CT"}, {"SC", "GA", 
    "NC"}, {"WA", "OR", "ID"}, {"CA", "NV", "OR", "AZ"}, {"CT", "RI", 
    "MA", "NY"}, {"DE", "MD", "PA", "NJ"}, {"LA", "TX", "MS", 
    "AR"}, {"MI", "IN", "OH", "WI"}, {"ND", "SD", "MN", "MT"}, {"NH", 
    "ME", "VT", "MA"}, {"NJ", "NY", "PA", "DE"}, {"VT", "NH", "MA", 
    "NY"}, {"AL", "GA", "MS", "TN", "FL"}, {"AZ", "CA", "NM", "UT", 
    "NV"}, {"IN", "OH", "MI", "IL", "KY"}, {"KS", "OK", "CO", "MO", 
    "NE"}, {"MD", "DE", "PA", "VA", "WV"}, {"MN", "WI", "IA", "SD", 
    "ND"}, {"MS", "AL", "LA", "AR", "TN"}, {"MT", "ID", "WY", "SD", 
    "ND"}, {"NC", "SC", "VA", "TN", "GA"}, {"NM", "TX", "AZ", "CO", 
    "OK"}, {"WI", "IL", "MI", "IA", "MN"}, {"GA", "FL", "SC", "NC", 
    "AL", "TN"}, {"IL", "IA", "WI", "IN", "KY", "MO"}, {"MA", "VT", 
    "NH", "NY", "RI", "CT"}, {"NV", "CA", "AZ", "UT", "ID", 
    "OR"}, {"NY", "NJ", "VT", "PA", "MA", "CT"}, {"OH", "IN", "WV", 
    "PA", "KY", "MI"}, {"UT", "CO", "WY", "ID", "NV", "AZ"}, {"VA", 
    "WV", "MD", "NC", "TN", "KY"}, {"WV", "VA", "OH", "PA", "MD", 
    "KY"}, {"AR", "TX", "LA", "OK", "MO", "TN", "MS"}, {"CO", "UT", 
    "WY", "NM", "NE", "KS", "OK"}, {"IA", "IL", "WI", "MN", "SD", 
    "NE", "MO"}, {"ID", "WA", "OR", "NV", "UT", "WY", "MT"}, {"NE", 
    "KS", "CO", "WY", "SD", "IA", "MO"}, {"OK", "TX", "CO", "KS", 
    "NM", "AR", "MO"}, {"PA", "WV", "DE", "MD", "NJ", "NY", 
    "OH"}, {"SD", "ND", "MT", "WY", "NE", "IA", "MN"}, {"WY", "MT", 
    "ID", "UT", "CO", "NE", "SD"}, {"KY", "IL", "MO", "TN", "VA", 
    "WV", "OH", "IN"}, {"MO", "IA", "NE", "KS", "OK", "AR", "TN", 
    "KY", "IL"}, {"TN", "KY", "MO", "AR", "MS", "AL", "GA", "NC", 
    "VA"}, {"ME", "NH"}};

stateData = {"AK,61.3850,-152.2683", "AL,32.7990,-86.8073", "AR,34.9513,-92.3809", "AZ,33.7712,-111.3877", "CA,36.1700,-119.7462", "CO,39.0646,-105.3272", "CT,41.5834,-72.7622", "DC,38.8964,-77.0262", "DE,39.3498,-75.5148", "FL,27.8333,-81.7170", "GA,32.9866,-83.6487", "HI,21.1098,-157.5311", "IA,42.0046,-93.2140", "ID,44.2394,-114.5103", "IL,40.3363,-89.0022", "IN,39.8647,-86.2604", "KS,38.5111,-96.8005", "KY,37.6690,-84.6514", "LA,31.1801,-91.8749", "MA,42.2373,-71.5314", "MD,39.0724,-76.7902", "ME,44.6074,-69.3977", "MI,43.3504,-84.5603", "MN,45.7326,-93.9196", "MO,38.4623,-92.3020", "MS,32.7673,-89.6812", "MT,46.9048,-110.3261", "NC,35.6411,-79.8431", "ND,47.5362,-99.7930", "NE,41.1289,-98.2883", "NH,43.4108,-71.5653", "NJ,40.3140,-74.5089", "NM,34.8375,-106.2371", "NV,38.4199,-117.1219", "NY,42.1497,-74.9384", "OH,40.3736,-82.7755", "OK,35.5376,-96.9247", "OR,44.5672,-122.1269", "PA,40.5773,-77.2640", "RI,41.6772,-71.5101", "SC,33.8191,-80.9066", "SD,44.2853,-99.4632", "TN,35.7449,-86.7489", "TX,31.1060,-97.6475", "UT,40.1135,-111.8535", "VA,37.7680,-78.2057", "VT,44.0407,-72.7093", "WA,47.3917,-121.5708", "WI,44.2563,-89.6385", "WV,38.4680,-80.9696", "WY,42.7475,-107.2085"} ;

stateAbbreviations = Union[Flatten[stateConnections]]; stateToNumber = MapThread[ Rule, {stateAbbreviations, Range[Length[stateAbbreviations]]}]; numberToState = MapThread[ Rule, {Range[Length[stateAbbreviations]], stateAbbreviations}]; allConnections = Flatten[Function[e, Map[UndirectedEdge[First[e], #] &, Rest[e]]] /@ stateConnections]; connections = Union[Sort /@ allConnections]; stateCenters = First[StringSplit[#, ","]] -> ToExpression /@ RotateLeft @ Rest[StringSplit[#, ","]] & /@ stateData; stateCoords = (# & /@ stateAbbreviations) /. stateCenters; temp = Graph[connections /. stateToNumber]; vertexCoordinates = stateCoords[[VertexList[temp]]]; g = Graph[connections /. stateToNumber, VertexCoordinates -> vertexCoordinates, VertexLabels -> numberToState, VertexShapeFunction -> "Square", VertexSize -> 3, VertexLabelStyle -> Directive[Black, 12]];

Show[Graphics[{LightGray, CountryData["USA", "Polygon"]}], g, ImageSize -> 700]

graph of the usa

Apparently the order of the vertices is required from the graph before you can draw the vertices at the right coordinates on the graph - hence the weird use of temp = Graph[connections /. stateToNumber] before creating the graph again for real.

cormullion
  • 24,243
  • 4
  • 64
  • 133
  • Hi great answer .Can you bind your answer with the first answer?Cause the city connections are more important to me than the states.of course it is still a class to me – Alex Jul 12 '13 at 14:45
  • @alex no I can't :) I need the coordinates of each state in order to position the vertices correctly... – cormullion Jul 12 '13 at 14:55
  • Sorry it is very complex or I am underestimating that or...?Is it these data are just center of for example (W+E)/2 and (N+S)/2 here ???I think you had already done a big part. – Alex Jul 12 '13 at 15:10
  • @alex hmm yes, that's the data needed- just needs importing as a list and should be ok. I'll do it later perhaps. But looking again at the second graph you have in your question, I'm wondering what precisely you want to show. – cormullion Jul 12 '13 at 15:29
  • When you are running the code ,it returns the same graph or I need to add something?Do I need to call anything in Needs? – Alex Jul 12 '13 at 15:30
  • @alex nope, this is from a fresh kernel... – cormullion Jul 12 '13 at 15:35
  • My Kernel returns nothing.I am using MMA 9.0.1.Is it some problem with that? – Alex Jul 12 '13 at 15:43
  • I tested the first answer with Linux based MMA 9.0.1 and they dont support Delaunay command?!which version of MMA you are running please?are you getting the graph? – Alex Jul 12 '13 at 16:15
  • @cormullion Re: centroid, you might be able to use PolygonCentroid from here and use the polygon coordinates you get from CountryData – rm -rf Jul 12 '13 at 20:19
  • @rm-rf Well, I've struggled with this for long enough :) I thought it would be easier to get the shapes of US states and their two-letter codes. Still, if WRI did all the 'states' in the US they'd also have to do French 'departments', English counties, and the rest, just to be fair...:) – cormullion Jul 12 '13 at 22:58
  • @cormullion Ah, I forgot that CountryData doesn't have the US states' info. In that case, the spells in this answer might help with your O.W.L.s :) – rm -rf Jul 12 '13 at 23:16
7

I think what you are after is a Delaunay triangulation of the city coordinates. For example:

Graphics`Mesh`MeshInit[];

Graph[
 Range[Length[uScityCoords]],
 UndirectedEdge @@@ Delaunay[Reverse[uScityCoords, 2]]["Edges"],
 VertexCoordinates -> Reverse[uScityCoords, 2],
 VertexStyle -> Red, 
 Prolog -> {LightBrown, CountryData["USA", "FullPolygon"]}, 
 ImageSize -> 650
]

enter image description here

xyz
  • 605
  • 4
  • 38
  • 117
Simon Woods
  • 84,945
  • 8
  • 175
  • 324
  • many thanks .That is the answer.Great i have to admit thats amazing to me!!But i am kind of new in Mathematica.I know it is a big clue but it is not final code?Am i right?what is cd here? – Alex Jul 12 '13 at 14:41
  • @Alex, oops my apologies - cd was a symbol I was using for the polygon - I've restored it to how it should be. – Simon Woods Jul 12 '13 at 14:59
  • Does your code have to return your graph now?! – Alex Jul 12 '13 at 15:06
  • @Alex, I'm not sure what you mean by that last comment. – Simon Woods Jul 12 '13 at 15:10
  • I am coping your exact code and it returns nothing! What could be wrong? – Alex Jul 12 '13 at 15:14
  • BTW I am using MMA 9.0.1 – Alex Jul 12 '13 at 15:28
  • I tested it with Linux based MMA 9.0.1 and they dont support Delaunay command?!which version of MMA you are running please? – Alex Jul 12 '13 at 16:14
  • @Alex, I'm on version 8.0.4. You could take a look at the ComputationalGeometry package, that has a DelaunayTriangulation function. – Simon Woods Jul 12 '13 at 17:13
  • I have been testing it and found that but the ["Edges"] and VertexCoordinates -> Reverse[uScityCoords, 2] could not be assigned .I can only have result for Graph[Range[Length[uScityCoords]], UndirectedEdge @@@ DelaunayTriangulation[Reverse[uScityCoords, 2]]] which is not what I want.Just parallel lines. – Alex Jul 12 '13 at 18:21
6

Revised:

First, let's get some map data. This is an 8MB file and you might want to save it locally.

map = First@
   Import["http://www2.census.gov/geo/tiger/TIGER2009/tl_2009_us_\
state.zip", "Data"];

Then, look at the answers that are better than yours (nod nod cormullion), and steal from them. I'm taking the stateConnections and stateData he defines. I won't reprint them here.

shape = "Geometry" /. map;
names = "STUSPS" /. "LabeledData" /. map[[4]] // Quiet;
cshape = shape[[DeleteCases[Range[56], 
     Alternatives @@ {1, 5, 7, 19, 27, 28, 33, 38}]]];
cnames = names[[DeleteCases[Range[56], 
    Alternatives @@ {1, 5, 7, 19, 27, 28, 33, 38}]]]; shape = 
 "Geometry" /. map;
names = "STUSPS" /. "LabeledData" /. map[[4]] // Quiet;
themap = Show[
   MapThread[
    Graphics@{EdgeForm[{White, Thick}], FaceForm[LightGray], 
       Tooltip[#1, #2]} &, {cshape, cnames}]];

(* Make map points with Cormullion's data *)

cpoint2 = Reverse /@ Flatten[ToExpression[
       Cases[
        Map[StringSplit[#, ","] &, 
         stateData], {#, x__, y__} -> {x, y}]] & /@ cnames, 1];

(* Make adjacency matrix with Cormullion's data *)

Table[Map[{i, #} &, 
   Flatten@Position[cnames, 
     Alternatives @@ 
      Cases[stateConnections, x_ /; x[[1]] == cnames[[i]]][[1, 
        2 ;;]]]], {i, 1, 48}];
sam2 = SparseArray[Flatten[%, 1] -> 1];

(* Make adjacency graph *)

graph = AdjacencyGraph[Range[Length[cpoint2]], sam2, 
   VertexCoordinates -> cpoint2];
Show[themap, graph, Background -> LightBlue]

Here's what we get:

connection map

bobthechemist
  • 19,693
  • 4
  • 52
  • 138
  • Hi thanks looks very nice job. your code is crashing the kernel.Which version of MMA you are using mine is MMA 9.0.1 OS Mac – Alex Jul 12 '13 at 21:07
  • MMA 9.0.1 Win 7/64 - Memory does appear to be an issue with loading the shape files from TIGER. Is is that line or the subsequent commands? – bobthechemist Jul 12 '13 at 21:09
  • @Alex yup, something wrong with my revision - give me a few minutes. – bobthechemist Jul 12 '13 at 21:11
  • I don't know .The download part is alright.In next second part it remain irresponsible that I have to Force Quit the MMA – Alex Jul 12 '13 at 21:12
  • BTW can you run the Simon's code in your PC? – Alex Jul 12 '13 at 21:13
  • @Alex I fixed the problem with my code. Remember that you need to execute Cormullion's stateConnections and stateData for mine to work. – bobthechemist Jul 12 '13 at 21:20
  • Sorry same problem.Even first version didn't work here.It is not responding!!!at all and I have to Force Quit.In Win like end task! – Alex Jul 12 '13 at 21:27
4

Another trivial way to keep the cities connected and at the same time reduce the number of edges in the graph.

<< ComputationalGeometry`;
rule = MapThread[#1 -> #2 &, {uScityCoords, largUSCities}];
graph = (Rest@PlanarGraphPlot[uScityCoords][[1, 2]] /. 
 Line[{a_, b_}] -> UndirectedEdge[a, b]) /. rule; 
gorg = Graph[graph, VertexCoordinates -> Reverse[uScityCoords, 2], 
 EdgeStyle -> Directive[Opacity[.6], Gray, Thick], 
 VertexSize -> 0.8,Prolog -> {LightRed, CountryData["USA", "FullPolygon"]}, 
 ImageSize -> 450, AspectRatio -> .5]; 
convexhull = ConvexHull[uScityCoords];
conv =PlanarGraphPlot[Reverse[uScityCoords, 2], convexhull,LabelPoints -> False];
edge = EdgeList[g];
g = gorg;
For[i = 1, i <= 1500, i++,
ng = EdgeDelete[g, RandomChoice@edge];
g = If[ConnectedGraphQ[ng] === True, edge = EdgeList[ng]; ng, g];
];
Row@{gorg, Spacer[60], Show[g, conv, AspectRatio -> .5]}

enter image description here

PlatoManiac
  • 14,723
  • 2
  • 42
  • 74
  • 1
    Cool pictures! Although the OP's picture suggests that they want to connect only each adjacent state... – cormullion Jul 12 '13 at 13:11
  • @cormullion you had already done that nicely when I saw this question so I thought to add little randomness to the set of answers...;) – PlatoManiac Jul 12 '13 at 14:07
  • 1
    if only we could put our two answers in a blender:) – cormullion Jul 12 '13 at 14:34
  • Hi ,many thanks but the first answer is what I am looking for.Of course Cormullion's answer is great but it needs some manual considerations. – Alex Jul 12 '13 at 14:43
1

I asked about something similar, but it's with data for municipalities in Brazil. Since I couldn't find the names and locations for them on WolframAlpha (well at least not elegantly) then I resorted to the sledgehammer approach. Where I the image of the map, added a layer to it and then put dots where I wanted the nodes to go. After that I could have used morphologicalgraph to get their positions and then have the background of my graph be an image. Here is the question: Adding an image background to a graph that uses vertexposition

E3labs
  • 475
  • 2
  • 12