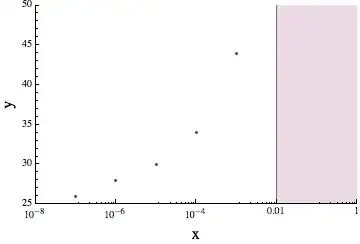
Hi I would simply like to fill in the region from a vertical gridline to the right boundry of the plot
Here is an example
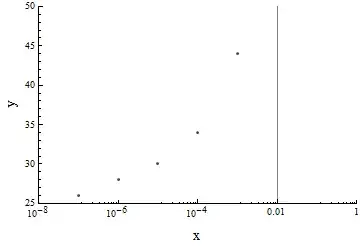
z0vals = {1.*^-8, 1.*^-7, 1.*^-6, 0.00001, 0.0001, 0.001};
evvals = {25, 26, 28, 30, 34, 44};
ptsS = MapThread[List, {z0vals, evvals}]
ListLogLinearPlot[ptsS,
PlotRange -> {{10^-8, 1}, {25, 50}},
Frame -> {True, True, False, False},
FrameLabel -> {Style["x", FontSize -> 16],
Style["y", FontSize -> 16]}, GridLines -> {{0.01}, None}]
that looks like this
(i.e. shade the region from x = 0.01 to 1)
many thanks.
Fillingspecifications or similar, but you could just draw a rectangle over this part of the figure. – Oleksandr R. Jul 12 '13 at 14:22