Let the given set of points
points = {{395.4416644777464`,
    207.63931734339303`}, {391.15890276860114`,
    240.47382378017346`}, {382.59337935031067`,
    219.06001523444706`}, {378.3106176411653`,
    209.0669045797748`}, {369.74509422287485`,
    177.65998537937617`}, {361.1795708045843`,
    250.4669344348457`}, {355.46922185905726`,
    204.78414287062958`}, {346.9036984407667`,
    236.19106207102823`}, {341.19334949523966`,
    184.79792156128497`}, {332.6278260769492`,
    220.48760247082885`}, {326.9174771314222`,
    214.77725352530183`}, {322.6347154222768`,
    260.4600450895181`}, {316.9243664767498`,
    219.06001523444706`}, {314.06919200398636`,
    241.90141101655524`}, {304.076081349314`,
    119.12890868772422`}, {295.5105579310235`,
    327.5566451994606`}, {278.3795110944425`,
    156.24617683364988`}, {269.8139876761519`,
    251.8945216712275`}, {264.1036387306249`,
    196.218619452339`}, {258.39328978509786`,
    286.1566153443896`}, {249.8277663668073`,
    233.33588759826466`}, {241.26224294851679`,
    173.37722367023093`}, {231.26913229384448`,
    184.79792156128497`}, {224.13119611193568`,
    286.1566153443896`}, {215.56567269364515`,
    160.52893854279512`}, {199.86221309344583`,
    303.28766218097076`}, {184.1587534932465`,
    72.01852988712619`}, {172.73805560219247`,
    587.3775222209401`}, {162.74494494752017`,
    83.43922777818022`}, {149.89665982008435`,
    260.4600450895181`}, {145.61389811093912`,
    254.74969614399106`}, {138.47596192903032`,
    317.56353454478824`}, {131.33802574712158`,
    183.37033432490318`}, {124.20008956521278`,
    193.36344497957543`}, {119.91732785606749`,
    160.52893854279512`}, {112.77939167415872`,
    214.77725352530183`}, {108.49662996501345`,
    199.07379392510256`}, {105.64145549224995`,
    250.4669344348457`}, {101.35869378310466`,
    324.70147072669704`}, {98.50351931034115`,
    224.77036417997408`}, {91.36558312843238`,
    220.48760247082885`}, {81.37247247376007`,
    96.28751290561604`}, {75.66212352823305`,
    200.50138116148423`}, {72.80694905546954`,
    351.82562821795045`}, {54.24831498250671`,
    154.8185895972681`}, {41.4000298550709`,
    240.47382378017346`}, {35.68968090954388`,
    236.19106207102823`}, {32.83450643678037`,
    280.4462663988626`}, {12.848285127435787`,
    131.97719381515992`}, {7.1379361819087705`, 227.62553865273765`}};
define the coordinates for the piecewise constant function generated as such:
points2 = {#[[1]], #[[2]] - 72.01852988712619`} & /@ points;
Clear[t];
f[t_] = Piecewise[
Partition[Sort[points2], 2,
1] /. {{a_?NumericQ, b_}, {c_, d_}} :> {b, a <= t < c}];
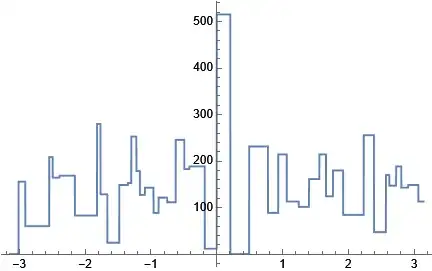
f1[t_] = f[(172.73805560219247` (t + Pi)/Pi)];
Plot[f1[t], {t, -Pi, Pi}]
Then we obtain the plot

However, I would like to generate an interpolation of this function, I tried
Interpolation[f1[t]]
But got
Interpolation::innd: First argument in Piecewise[{{155.607,7.13794<=54.9842 ([Pi]+t)<12.8483},{59.9587,12.8483<=54.9842 ([Pi]+t)<32.8345},{208.428,32.8345<=54.9842 ([Pi]+t)<35.6897},{164.173,35.6897<=54.9842 ([Pi]+t)<41.4},{168.455,41.4<=54.9842 ([Pi]+t)<54.2483},{82.8001,54.2483<=54.9842 ([Pi]+t)<72.8069},{279.807,72.8069<=54.9842 ([Pi]+t)<75.6621},{128.483,75.6621<=54.9842 ([Pi]+t)<81.3725},{24.269,81.3725<=54.9842 ([Pi]+t)<91.3656},{148.469,91.3656<=54.9842 ([Pi]+t)<98.5035},<<39>>},0] does not contain a list of data and coordinates."
I tried also to interpolate the Fourier series of this function:
Interpolate[FD[t_] = FourierSeries[f1[t], t, 20]]
However, I am not sure this is the best way to do it.
Any ideas?
Thanks
Thanks