Here's an example of Mathematica calling javaplex. See https://reference.wolfram.com/language/JLink/tutorial/CallingJavaFromTheWolframLanguage.html for syntax and other details.
From https://github.com/appliedtopology/javaplex/releases/ I downloaded the jar to ~/Desktop/javaplex/library/javaplex.jar. Now let's follow their hello world from https://github.com/appliedtopology/javaplex/wiki/Tutorial.
loading geometry
Needs@"JLink`"
Remove[stream, intervals]
ReinstallJava[ClassPath -> AbsoluteFileName@"~/Desktop/javaplex/library/javaplex.jar"];
LoadJavaClass@"edu.stanford.math.plex4.api.Plex4"
(make triangle)
stream = Plex4`createExplicitSimplexStream[];
stream@addVertex@# & /@ Range[0, 2];
stream@addElement@# & /@ {{0, 1}, {0, 2}, {1, 2}};
stream@finalizeStream[];
stream@getSize[]
intervals = Plex4`getModularSimplicialAlgorithm[3, 2]@computeIntervals@stream
intervals@toString[]
(*  Dimension: 0
    [0.0, infinity)
    Dimension: 1
    [0.0, infinity) *)
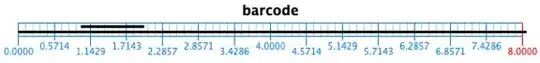
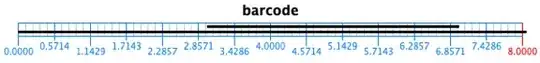
barcode image
We can call drawBarcode from the class BarcodeVisualizer. The result is a java BufferedImage, which can be converted as per How to convert a Java BufferedImage to a Mathematica Image?.
LoadJavaClass[#,StaticsVisible->True]&/@
  {"edu.stanford.math.plex4.visualization.BarcodeVisualizer",
   "javax.imageio.ImageIO"}
importBufferedImage[bi_]:=(ImageIO`write[bi,"png",#];ImportByteArray[ByteArray@Mod[#@toByteArray[],2^8],"PNG"])&@JavaNew@"java.io.ByteArrayOutputStream"
stream = Plex4createExplicitSimplexStream[]; stream@addVertex[#, 0] & /@ Range@4; stream@addVertex[5, 1]; stream@addElement[{#, 1 + Mod[#, 4]}, 0] & /@ Range@4; stream@addElement[{3, 5}, 2]; stream@addElement[{4, 5}, 3]; stream@addElement[{3, 4, 5}, 7]; stream@finalizeStream[]; intervals = (Plex4getModularSimplicialAlgorithm[3, 2])@computeIntervals@stream;
importBufferedImage@BarcodeVisualizer`drawBarcode[
  intervals@getIntervalsAtDimension@#, "barcode", 8]&/@{0,1}


Table[{Random[],Random[]},{i,1,200}]– Preem Jul 04 '23 at 12:32PersistentHomologyis computingsimpweights, the max entry of the distance matrices of each simplex. This is with 200 random points as input, and there are 1333500 simpexes! – Adam Jul 04 '23 at 16:36