There is way to style individual Contours:
{{f1, gr1},...} contours drawn with graphics directives gri
and a way to have a function compute the contours for you:
func a function to be applied to zmin, zmax to get the list of contours
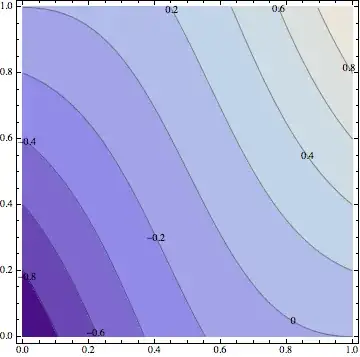
Unfortunately they do not seem to cooperate -- that is, if func returns a list of contour levels and graphics directives {{f1, gr1},...}, all I get is a gray square for the plot. No error warnings, no contours. If this is by design, it seems that it leaves room for improvement.
However, one can take a two-step approach. Below is a function that does one contour plot to compute the list of styled contours and another to compute the image. To improve speed, by default, MaxRecursion is set to 0; this can be overridden. All we really need to know to compute the contours is the maximum and minimum of the plotted function over the domain. There are various ways to compute this. ContourPlot is one. Sometimes human inspection is quick enough. If I can assume quality is more important than speed, then a double ContourPlot is reasonable.
I made a some attempt to provide an interface with ContourPlot, but the variety of forms of the options, especially Contours and ContourStyle, and my limited time led to a partial implementation.
The function cFn yields a Function that computes the styled contours. Each contour has to be styled with this form of the option Contours. I apply the ContourStyle cStyle, which needs to be a single style, to the union of the user-styled and the automatically generated contours. The styles of the user-styled contours are then replaced by the styles the user specifies. The integer nContours represents the "target" number of contours to be returned by FindDivisions; it won't be the exact number of contours due to the workings of FindDivisions.
If the max/min of the function are known, then contours = cFn[styledContours][min, max] may be used to compute the value for the option Contours -> contours directly.
To use cplot, just pass a list of contours in the form {{f1, gr1},...}, the same as for the option Contours, followed by the arguments for ContourPlot.
Clear[cFn];
cFn[styledContours_, nContours_: 10, cStyle_: {GrayLevel[0], Opacity[0.4]}] /;
  ArrayDepth[styledContours] == 1 := cFn[{styledContours}, nContours];
cFn[styledContours_, nContours_: 10, cStyle_: {GrayLevel[0], Opacity[0.4]}] :=
  Function[{min, max}, {#, cStyle} & /@
      Union[First /@ N@styledContours, N @ FindDivisions[{min, max}, nContours]] /.
     Thread[{#, cStyle} & /@ First /@ N @ styledContours -> styledContours]];

ClearAll[cplot];
SetAttributes[cplot, HoldAll];
cplot[styledContours_, fn_, dom1_, dom2_, opts : OptionsPattern[ContourPlot]] :=
 Module[{contours},
  ContourPlot[fn, dom1, dom2, PlotPoints -> OptionValue[PlotPoints],
   MaxRecursion ->
    If[OptionValue[MaxRecursion] === Automatic, 0, OptionValue[MaxRecursion]],
   Contours -> ((contours = cFn[styledContours,
                  If[IntegerQ[OptionValue[Contours]], IntegerQ[OptionValue[Contours]], 10],
                  OptionValue[ContourStyle]][##]) &)];
  ContourPlot[fn, dom1, dom2, Contours -> contours, opts]
  ]
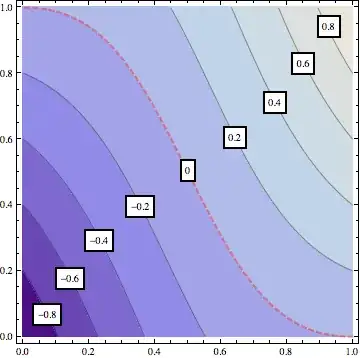
Example
cplot[{0, {Thick, Red}}, (-1 + x)^2 (-1 + y) + x^2 y,
 {x, 0, 1}, {y, 0, 1}, ContourLabels -> True]

I hope that helps. If Contours -> func ever works the way I think it should, this would be a bit easier.

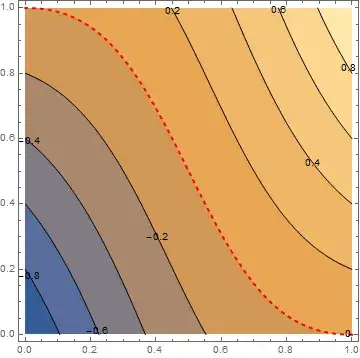
Contours -> (Table[i, {i, -.8, .8, .2}]~Join~{{0, Directive[Thick, Red]}})– Kuba Jul 18 '13 at 08:35Contours -> (If[# == 0, {0, Directive[Thick, Dashed, Red]}, #] & /@ Range[-.8, .8, .2])so it doesn't draw the 0-contour line twice. – Jul 18 '13 at 08:38