7

I want to generate a picture like this, highlight its outlines, don't show extra edges.
enter image description here
The built-in MengerMesh will have extra edges

mesh = MengerMesh[2, 3];
Graphics3D[{
  {EdgeForm[], mesh},
  {Thick, MeshPrimitives[mesh, 1]}
  }, Boxed -> False]

enter image description here
I've tried the method here, It seems that it doesn't work for regions with holes.

Region`Mesh`MergeCells[BoundaryDiscretizeRegion@MengerMesh[2, 3]]
expression
  • 5,642
  • 1
  • 19
  • 46

2 Answers2

12

3.

Inspired by chayong's answer, a direct way to identify the boundary edges using Region`Mesh`MeshCellNormals:

bmr = BoundaryMesh[MengerMesh[2, 3]];

boundaryedges = Pick[MeshPrimitives[bmr, 1], Map[Unitize @ (1 - Max @ Abs @ #)&] @ RegionMeshMeshCellNormals[bmr, 1],1];

Show[bmr, Graphics3D[{AbsoluteThickness[3], boundaryedges}], Boxed -> False]

enter image description here

Alternatively, we identify the indices of boundary edges and highlight them using HighlightMesh:

boundaryindices = Pick[MeshCellIndex[bmr, 1][[All, 2]], 
  Map[Unitize @ (1 - Max @ Abs @ #)&] @ Region`Mesh`MeshCellNormals[bmr, 1], 1];

HighlightMesh[bmr, Style[{1, boundaryindices}, Directive[Black, AbsoluteThickness[3]]]]

enter image description here

1.

Combine co-planar faces and plot them using RegionPlot3D using the option BoundaryStyle:

bdm = BoundaryMesh @ MengerMesh[2, 3];

faces = MapApply[RegionUnion] @ Gather[MeshPrimitives[bdm, 2], CoplanarPoints[Join[First @ #, First @ #2]] &];

RegionPlot3D[Evaluate @ faces, Mesh -> None, MaxRecursion -> 5, BoundaryStyle -> Directive[Thick, Black], Boxed -> False, Lighting -> "Neutral", ViewProjection -> "Orthographic", ColorFunctionScaling -> False, ColorFunction -> (ColorData["BlueGreenYellow"][5/3 SquaredEuclideanDistance[{#, #2, #3}, {1, 1, 1}/2]] &)]

enter image description here

Remove the options ViewProjection,ColorFunctionScaling and ColorFunction to get

enter image description here

2.

Get RegionMember function for MengerMesh[2,3] and use it with RegionPlot3D:

rmf = RegionMember @ MengerMesh[2, 3];

RegionPlot3D[rmf @ {x, y, z}, {x, 0, 1}, {y, 0, 1}, {z, 0, 1}, Mesh -> None, MaxRecursion -> 5, PlotPoints -> 200, Boxed -> False, Axes -> False, BoundaryStyle -> Thick, Lighting -> "Neutral"]

enter image description here

Note that, unlike the first method above, this method fails to style the interior edges.

kglr
  • 394,356
  • 18
  • 477
  • 896
5

Updated
BoundaryMesh is not needed, faster than the previous version

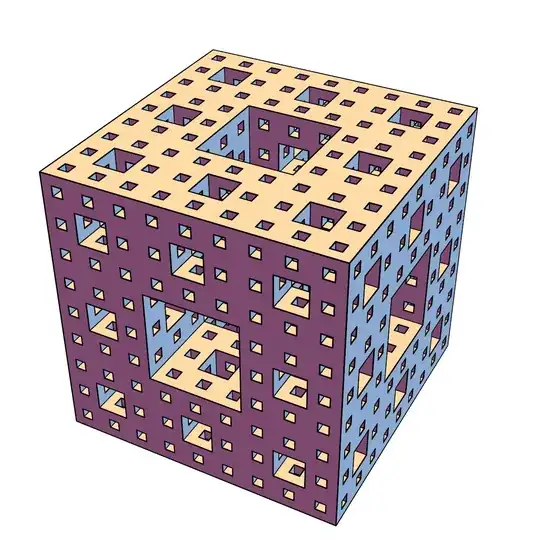
mesh = MengerMesh[4, 3];
idx = {1, 2, 2, 3, 3, 4, 4, 1, 5, 6, 6, 7, 7, 8, 8, 5, 1, 5, 2, 6, 3, 7, 4, 8};
outlines = MeshPrimitives[mesh, 3][[All, 1, idx]] //
    RightComposition[
     ArrayReshape[#, {Times @@ Dimensions@#/6, 2, 3}] &,
     Map[Sort],
     Tally,
     Cases[{x_, 1} :> x],
     Developer`ToPackedArray,
     Line
     ]; // AbsoluteTiming

Graphics3D[{ {EdgeForm[], mesh}, {Black, Tube[outlines, Scaled[1/1000]]} }, Boxed -> False, ImageSize -> 800, Lighting -> "Classic"]

{3.31279, Null}
enter image description here


Using method in Extract 2D quad mesh from 3D hexahedral mesh, add some optimization

Clear[boundaryMeshOutlines];
boundaryMeshOutlines[bmr_BoundaryMeshRegion, tol_ : 0.] :=
  Module[{enormal, graph, edges, vl, adj, corneredges},
   enormal = Region`Mesh`MeshCellNormals[bmr, 2];
   graph = MeshConnectivityGraph[bmr, {1, 2}];
   edges = MeshCellIndex[bmr, 1];
   vl = VertexList[graph];
   adj = Lookup[AssociationThread[vl, Extract[vl, 
    List/@ AdjacencyMatrix[graph]["AdjacencyLists"]]], edges][[All, All, 2]];
   corneredges = Pick[edges, UnitStep[(Dot @@ enormal[[#]] & /@ adj) - 1 + tol], 0];
   MeshPrimitives[bmr, corneredges, "Multicells" -> True]
   ];

bmesh = BoundaryMesh[MengerMesh[3, 3]]; outlines = boundaryMeshOutlines[bmesh]; // AbsoluteTiming Graphics3D[{ {EdgeForm[], bmesh}, {Black, Tube[#, Scaled[1/800]] & /@ outlines} }, Boxed -> False, ImageSize -> 600]

{0.30785, Null}
enter image description here

It also works for this Construct a polyhedron from the coordinates of its vertices and calculate the area of each face

q={{-10.,-7.5,-6.25},{-10.,-7.5,6.25},{-10.,0.,-10.},{-10.,0.,10.},{-10.,7.5,-6.25},{-10.,7.5,6.25},{-1.66667,-11.6667,-8.33333},{-1.66667,-11.6667,8.33333},{2.5,-13.75,0.},{-2.5,0.,-13.75},{1.66667,-8.33333,-11.6667},{-2.5,0.,13.75},{1.66667,-8.33333,11.6667},{-1.66667,11.6667,-8.33333},{1.66667,8.33333,-11.6667},{-1.66667,11.6667,8.33333},{1.66667,8.33333,11.6667},{2.5,13.75,0.},{10.,-10.,0.},{10.,-6.25,-7.5},{10.,-6.25,7.5},{10.,6.25,-7.5},{10.,6.25,7.5},{10.,10.,0.}};

bdm=BoundaryMesh@DelaunayMesh[q];

Graphics3D[{ {EdgeForm[], bdm}, {Black, Tube[#, Scaled[1/800]] & /@ boundaryMeshOutlines[bdm, 10^-5.]} }, Boxed -> False, ImageSize -> 600]

enter image description here

chyanog
  • 15,542
  • 3
  • 40
  • 78