I have voted for @cvgmt. This is for fun:
The rational points of circle with denominator 25 can generated (excluding degenerate points):
r1 = 3/5 + 4/5 I;
r2 = 4/5 + 3/5 I;
pts = ReIm[
   Union[Times @@@
     Tuples[{1, r1, r2, Conjugate@r1,
       Conjugate@r2, -r1, -r2, -Conjugate[r1], -Conjugate[r2]},
      2]]] /. {{x_, 0} :> Nothing, {0, x_} :> Nothing}
{{-(24/25), -(7/25)}, {-(24/25), 7/25}, {-(4/5), -(3/5)}, {-(4/5), 3/
5}, {-(3/5), -(4/5)}, {-(3/5), 4/5}, {-(7/25), -(24/25)}, {-(7/25),
24/25}, {7/25, -(24/25)}, {7/25, 24/25}, {3/5, -(4/5)}, {3/5, 4/
5}, {4/5, -(3/5)}, {4/5, 3/5}, {24/25, -(7/25)}, {24/25, 7/25}}
RelationGraph can be used to get the squares (and rescaling to get integers):
rg = RelationGraph[#1 . #2 == 0 &, 25 pts,
   VertexCoordinates -> (25 pts), VertexLabels -> "Name"];
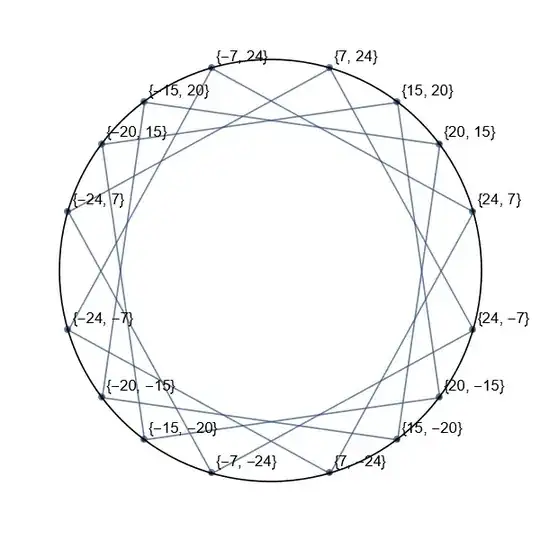
Visualizing:
lp = ListPlot[25 pts, AspectRatio -> Automatic,
 Epilog -> Circle[{0, 0}, 25]];
Show[lp, rg, PlotRange -> Table[{-32, 32}, 2], Axes -> False]


{x,y},{-y,x},{-x,-y},{y,-x}where{x,y}is Gaussian Integers. – cvgmt Aug 12 '23 at 03:17pts = {{-15, -20}, {7, -24}, {20, 15}, {24, -7}}; Graphics[{ {Dashed, Black, CircleThrough[pts]} , {FaceForm[Lighter@Yellow], EdgeForm[Black], Polygon[SortBy[pts, ArcTan]]} , {Red, AbsolutePointSize[6], Point /@ pts} , Text[#, #, {-1.5, 0}] & /@ pts } , ImageSize -> 300 , Frame -> True ]– Syed Aug 12 '23 at 04:51