15

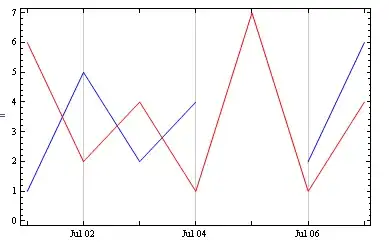
I have a set of data taken on sequential days, but some points are missing. I'd like to make a joined date list plot, where the points are not joined across the missing point.The following example illustrates the desired result.

data1 = {
{{2013, 7, 1}, 1},
{{2013, 7, 2}, 5},
{{2013, 7, 3}, 2},
{{2013, 7, 4}, 4},
{{2013, 7, 6}, 2},
{{2013, 7, 7}, 6}
};
data2 = {
{{2013, 7, 1}, 6},
{{2013, 7, 2}, 2},
{{2013, 7, 3}, 4},
{{2013, 7, 4}, 1},
{{2013, 7, 5}, 7},
{{2013, 7, 6}, 1},
{{2013, 7, 7}, 4}
};
DateListPlot[{
data1[[1 ;; 4]],
data1[[5 ;; 6]],
data2[[ ;; ]]
}, PlotStyle -> {Blue, Blue, Red}, Joined -> True]

Note that data1 is missing a point on July 5. In practice I'm doing this with multiple data sets, with hundreds of points, so breaking it apart and manually assiging plotstyle like I have here is not viable.

How can I make Joined skip missing points?

user64494
  • 26,149
  • 4
  • 27
  • 56
mdeceglie
  • 968
  • 4
  • 14

5 Answers5

19

You can do this pretty cleanly with TemporalData. Setting the Method to None ensures no interpolation will be performed. The "Part" property resamples the paths when necessary using the Method setting. Since it was set to None it gives missing at days not present in the data.

td = TemporalData[{data1, data2}, Method -> None];
resample = td["Part", All, {Automatic, Automatic, "Day"}]["Paths"]

DateListPlot[resample, Joined -> True, PlotStyle -> {Blue, Red}]

enter image description here

Andy Ross
  • 19,320
  • 2
  • 61
  • 93
  • 3
    +1 Only works in version 9, though... – Jens Jul 25 '13 at 18:03
  • Cool! I figured there was a way to do this with TemporalData, but hadn't looked into it yet (ie. emailed you.) – Brett Champion Jul 25 '13 at 18:17
  • Andy, do you have any thoughts on how memory efficient (packing wise) and computationally efficient these TemporalData objects might be? I have data that (on the lower end) runs at about 1 sample/sec for 1 year. I currently custom slice-n-dice functions and workarounds for missing/corrupt data, etc. Everything is in terms of packed functions to keep memory and execution time small. I haven't had the chance to test TemporalData for my needs, since this project is well past it, but before I take the plunge the next time, I wanted to ask you if you had any thoughts on this. – rm -rf Aug 23 '13 at 04:15
  • 1
    @rm-rf They use packed arrays when possible for values and store times as {tmin, tmax, dt} (again when possible) rather than an explicit list of times. This is actually a very general and quite powerful object but it is a bit prickly (in M9) and takes some getting used to. – Andy Ross Aug 23 '13 at 19:22
7

This is related to Simpler way to fill date gaps with zero values.
Combined with R.M's tip regarding Indeterminate we could use:

fillDates[dates_, val_:0] :=
  {#, Replace[#, Dispatch@Append[Rule @@@ dates, _ -> val], {1}]}\[Transpose] & @
    Part[DateList /@ Range[##, 24*60^2] & @@ AbsoluteTime /@ dates[[{1, -1}, 1]], All, ;; 3]

DateListPlot[
  fillDates[#, Indeterminate] & /@ {data1, data2},
  PlotStyle -> {Blue, Red},
  Joined -> True
]

enter image description here

Mr.Wizard
  • 271,378
  • 34
  • 587
  • 1,371
  • 1
    Instead of Indeterminate you could also use Missing[]. – Jens Jul 25 '13 at 17:27
  • 1
    @Jens It seems we can use Null or "" as well! Can you confirm? – Mr.Wizard Jul 25 '13 at 17:29
  • 3
    Yes, anything that's undefined - but I thought Missing is more appropriate here and may actually make the result of fillDates more usable for other purposes... – Jens Jul 25 '13 at 17:31
5

Why not just write a function to split up the data for you and then plot it.

edit: now with automated PlotStyle coloring

splitdata[data_] := 
 Split[data, DateDifference[#1[[1]], #2[[1]]] == 1 &]

split = splitdata /@ {data1, data2};
lengths = Length /@ split;
colors = {Blue, Red, Green, Purple};
DateListPlot[Join @@ split, Joined -> True, 
 PlotStyle -> 
  Flatten@MapThread[
    ConstantArray, {Take[colors, Length@lengths], lengths}]]

enter image description here

s0rce
  • 9,632
  • 4
  • 45
  • 78
2
a =
  {{{2013, 7, 1}, 1}, {{2013, 7, 2}, 5}, {{2013, 7, 3}, 2}, {{2013, 7, 4}, 4}, {{2013, 7, 6}, 2}, {{2013, 7, 7}, 6}};

b =
  {{{2013, 7, 1}, 6}, {{2013, 7, 2}, 2}, {{2013, 7, 3}, 4}, {{2013, 7, 4}, 1}, {{2013, 7, 5}, 7}, {{2013, 7, 6}, 1}, {{2013, 7, 7}, 4}};

KeyUnion automatically replaces missing values with Missing[]:

KeyUnion[{<|Rule @@@ a|>, <|Rule @@@ b|>}] // DateListPlot

enter image description here

eldo
  • 67,911
  • 5
  • 60
  • 168
0

TimeSeriesResample + ResamplingMethod

ts = TimeSeriesResample[{data1, data2}, "Union", ResamplingMethod -> None];

DateListPlot[ts, PlotStyle -> {Blue, Red}]

enter image description here

kglr
  • 394,356
  • 18
  • 477
  • 896