Realize than you are mapping only points in a tiny rectangular portion of infinite upper half plane {-200, 200 + 400 I} so the points can not be spread over the whole area of a triangle. And also the density of points that is even on half plane would not be even on the triangle.
I do not know where the function F[z] = EllipticK[z]/EllipticK[1-z] came from and what triangle it should represent (spherical, hyperbolic, Euclidean) but I assume it is correct (have not checked that).
From Schwarz_triangle_function I took this definition of Euclidean triangle mapping to compare with OP function.
(*function fu[z] from wiki*)
a = (1 - α - β - γ)/2;
b = (1 - α + β - γ)/2;
c = 1 - α;
aa = a - c + 1;
bb = b - c + 1;
cc = 2 - c;
fu[z_] :=
 z^α Hypergeometric2F1[aa, bb, cc, z]/
    Hypergeometric2F1[a, b, c, z] /.
   z -> z /. {α -> 1/3, β -> 1/3, γ -> 1/3}
(OP's function F[z])
F[z_] := EllipticK[z]/EllipticK[1 - z]
Now OP's plots of both:
data = RandomComplex[{-10, 10 + 2*10 I}, 10^5];
uhp = ComplexListPlot[data];
polygon = ComplexListPlot[F[data], PlotRange -> {{0, 2}, {0, 2}}];
GraphicsRow[{uhp, polygon}]
polygon =
  ComplexListPlot[fu[data],
   PlotRange -> {{0.88331 - 1, 0.88331 + 1}, {-0.1, 1.6}},
   Epilog -> {Line[{{0, 0}, {1.7666387502854501, 0}, {0.88331,
        1.52995403}, {0, 0}}]}];
GraphicsRow[{uhp, polygon}]

So we see mappings seems to be correct, although OP's mapping is not Euclidean triangle.
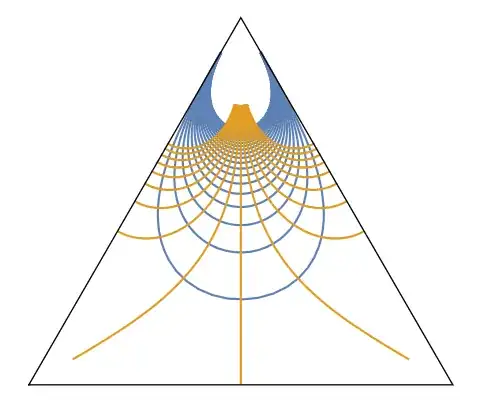
There is a better depiction of mappings (not by random points but) by grid lines.
Here is such a depiction that uses the wiki's function fu[z].
ParametricPlot[
  Table[ReIm[fu[x + I y]], {y, 1/2, 10, 1/2}], {x, -200, 200},
  Frame -> False, Axes -> False,
  Epilog -> {Line[{{0, 0}, {1.7666387502854501, 0}, {0.88331,
       1.52995403}, {0, 0}}]},
  PlotRange -> {{0.88331 - 1, 0.88331 + 1}, {-0.1, 1.6}}];
ParametricPlot[
  Table[ReIm[fu[x + I y]], {x, -4, 5, 1/2}], {y, 0.01, 20},
  PlotStyle -> ColorData[97, 2], Frame -> False, Axes -> False];
Show[%%, %]