10

Say I have a 3D curve that is parametrically defined. How would I be able to plot shapes like figure 8's whose centers are aligned along the 3D curve?

Say the curve was:

P[a_] := {-a, a, 1/2 a (8 - a)};
arch = ParametricPlot3D[P[a], {a, 0, 8}, Axes -> Automatic, AxesLabel -> {"x", "y", "z"},
                        PlotRange -> All, Boxed -> False, BoxRatios -> Automatic]

Does anyone know how I might be able to do this?

J. M.'s missing motivation
  • 124,525
  • 11
  • 401
  • 574
J. Musk
  • 157
  • 1
  • 8

3 Answers3

13

For this, you could use the answer by J.M. to the question "Extruding along a path". The question here isn't a duplicate because it makes use of features in J.M.'s excellent answer that go beyond what the linked question actually asked for. In particular, that answer can deal with self-intersecting cross sectional curves, which is what you need for this question:

So what you have to do is: first copy the definitions in J.M.'s answer and then define your custom cross section:

cs = First@
   Cases[ParametricPlot[
     BSplineFunction[{{0., 0.}, {0.25, 0.25}, {0.25, 0.}, {0., 0.25}},
         SplineClosed -> True][u] // Evaluate, {u, 0, 1}, 
     MaxRecursion -> 1], Line[l_] :> l, ∞];

Graphics3D[{EdgeForm[], TubePolygons[path, cs]}, Boxed -> False]

tube

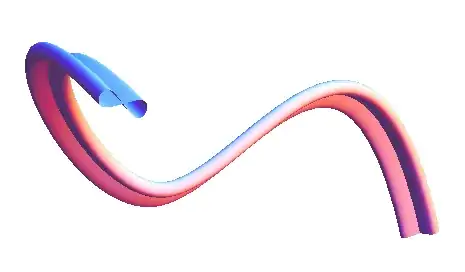
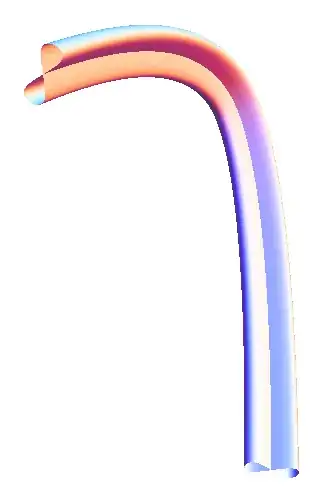
For your arch example, it looks like this:

P[a_] := {-a, a, 1/2 a (8 - a)};
path = First@
   Cases[ParametricPlot3D[P[a], {a, 0, 8}, MaxRecursion -> 1], 
    Line[l_] :> l, ∞];

Graphics3D[{EdgeForm[], TubePolygons[path, 5 cs]}, Boxed -> False]

arch

Edit: discrete shapes

Here is a discrete version where the shapes are inserted at positions given in a table. For the math behind the rotation transformation, have a look at "Finding unit tangent, normal, and binormal vectors for a given r(t)":
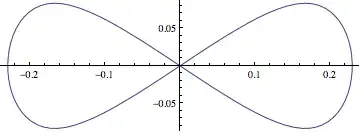
figureEight = 
 ParametricPlot[
  BSplineFunction[{-{0.25, 0.25}, {0.25, 0.25}, {0.25, -.25}, {-.25, 
       0.25}}, SplineClosed -> True][u] // Evaluate, {u, 0, 1}, 
  MaxRecursion -> 1]

eight

cs = First @ Cases[figureEight, Line[l_] :> l, ∞];

Clear[t];

r[t_] := P[t]

uT[t_] = Simplify[r'[t]/Norm[r'[t]], t ∈ Reals];

vN[t_] = Simplify[uT'[t]/Norm[uT'[t]], t ∈ Reals];

vB[t_] = Simplify[Cross[uT[t], vN[t]], t ∈ Reals];

Show[
 ParametricPlot3D[
  {P[t]}, {t, 0, 8}, PlotStyle -> {Blue, Thick}],
 Table[
  Graphics3D[{
    Translate[
     GeometricTransformation[Tube@Line[Map[Append[#, 0] &, 10 cs]], 
      Transpose[{vN[s], vB[s], uT[s]}]], P[s]]}], {s, 0, 8}], 
 PlotRange -> 10 {{-1.1, .2}, {-.2, 1.1}, {-.2, 1.1}}]

3d

The matrix in GeometricTransformation is made up of the three unit vectors tangent, normal, and bi-normal to the arc curve. The figure-eight shape is centered at the origin in a 2D coordinate system, so we have to first use Append to add a z-coordinate 0 to its points, and then align the orthogonal Cartesian axes with the normal and bi-normal vectors at a given point along the curve. Finally, the whole shape is translated to the location P[s] where s is the curve parameter.

J. M.'s missing motivation
  • 124,525
  • 11
  • 401
  • 574
Jens
  • 97,245
  • 7
  • 213
  • 499
  • Of course I may be misunderstanding the question. Maybe the "shapes" are supposed to be discrete. But in the absence of a specific statement, I assumed the shapes are as continuous as the path itself. – Jens Jul 29 '13 at 17:45
  • Yes I meant that the shapes would be discrete and that maybe i could specify the interval on which they appear. By my intuition I figured I should find an equation for the planes perpendicular to the curve at all points and then write a formula for the shape on those planes. I just dont know how to go about doing this. – J. Musk Jul 29 '13 at 17:51
  • I updated the answer with a discrete version of the shape. – Jens Jul 29 '13 at 18:47
5

A version 10 approach:

tnb[g_, t_] := Last@FrenetSerretSystem[g[t], t]
func[g_, t_, pc_, s_] := 
 Line[g[t] + # & /@ ((Plus @@ (tnb[g, v] #) & /@ 
       Table[PadLeft[s pc[j], 3], {j, 0, 1, 0.05}]) /. v -> t)]

Some test functions:

arc[t_] := {-t, t, 1/2 t (8 - t)};
helix[t_] := {Cos[ 2 t], Sin[ 2 t], 0.25 t}

f[u_] := BSplineFunction[{-{0.25, 0.25}, {0.25, 
      0.25}, {0.25, -.25}, {-.25, 0.25}}, SplineClosed -> True][u];
circ[u_] := {Cos[2 Pi u], Sin[2 Pi u]};

Testing:

Manipulate[Show[ParametricPlot3D[fu[t], {t, 0, 10}],
  Graphics3D[{Red, Thick, func[fu, par, pc, sc]}], 
  PlotRange -> Table[{-r, r}, {3}], Boxed -> False, Axes -> False, 
  Background -> Black],
 {fu, {arc, helix}}, {pc, {f -> "Figure of eight", 
   circ -> "Circle"}}, {sc, 0.1, 5}, {par, 0, 10}, {{r, 10, "range"}, 
  4, 12}]

enter image description here

Not an ideal gif but perhaps sufficient to illustrate.

ubpdqn
  • 60,617
  • 3
  • 59
  • 148
2

The routines in the answer Jens linked to can still be used if you just want to lay slices across your arch. Here is how to use them:

arch = Table[{-a, a, 1/2 a (8 - a)}, {a, 0, 8}];
figureEight = First @ Cases[ParametricPlot[
                    BSplineFunction[{-{0.25, 0.25}, {0.25, 0.25},
                                     {0.25, -.25}, {-.25, 0.25}}, SplineClosed -> True][u]
                    // Evaluate,
                                           {u, 0, 1}, MaxRecursion -> 1], Line[l_] :> l, 
                            Infinity];

slices = FoldList[Function[{p, t}, 
                           With[{o = orthogonalDirections[t]}, 
                                extend[#, t[[2]], t[[2]] - t[[1]], o] & /@ p]], 
                  crossSection[arch, 10, figureEight], 
                  Partition[arch, 3, 1, {1, 2}, {}]];

Show[ParametricPlot3D[{-a, a, 1/2 a (8 - a)}, {a, 0, 8}, 
                      PlotStyle -> Directive[Blue, Thick]],
     Graphics3D[Tube /@ slices], 
     PlotRange -> All, ViewPoint -> {1.3, 2.4, 2.}]

lemniscates on an arch

J. M.'s missing motivation
  • 124,525
  • 11
  • 401
  • 574