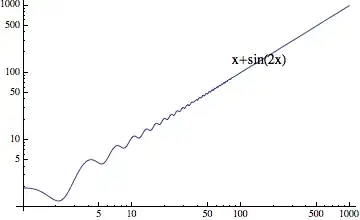
Hopefully this is a simple question. I'm trying to overlay some text on top of a LogLogPlot using Epilog and Text. However, I'm struggling with the coordinates that Text seems to be using for placement. For example:
LogLogPlot[x + Sin[2x], {x, 1, 1000},
  Epilog -> Style[Text["x+sin(2x)", {5, 5}], 14]]
places the label "x+sin(x)" at roughly {x,y}={150,150} on the plot's coordinate system, and not {5,5} as in the input. However, if I change the LogLogPlot to just Plot, the label will get placed at {5,5} (or wherever I specify). What's going on?
How it looks right now:
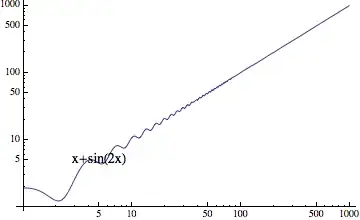
Logon the coordinates, this works:LogLogPlot[x + Sin[2 x], {x, 1, 1000}, Epilog -> Style[Text["x+sin(2x)", {Log[5], Log[5]}], 14]]– C. E. Jul 31 '13 at 22:01