I was recently looking over this very nice question by March Ho: Counting elements which are inside another element on a different colour channel
There are often times where I find myself wanting to draw a curve or define a polytope to cut out and isolate a part of an image for further analysis. One solution, for example, would be to define a set of polytope vertices, e.g.:
poly = {{658.`, 1224.`}, {672.`, 1054.`}, {507.`, 871.`}, {358.`, 876.`}, {344.`, 1432.`}, {483.`, 1410.`}};
And then calculate a winding number for each pixel in the image, or equivalently apply InPolygonQ, to define a "cutout" region. Here's a naive approach:
CutoutRegion = ImageData[pic];
ImageDimX = ImageDimensions[pic][[1]]
ImageDimY = ImageDimensions[pic][[2]]
Length[CutoutRegion[[1]]]
For[y = 1, y <= ImageDimY, y++,
For[x = 1, x <= ImageDimX, x++,
pt = {x, (ImageDimY-y)};
If[Graphics`Mesh`InPolygonQ[poly, pt] == True,
CutoutRegion[[y, x]] = 1;
,
CutoutRegion[[y, x]] = 0;
];
];
];
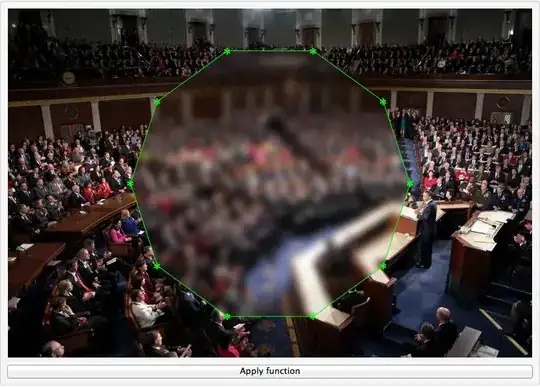
ImageMultiply[Image[CutoutRegion], pic]
This works, however very slowly, and it's a little bit clumsy to define a region of interest with a polygon. Really you'd want to freehand draw something.
My question is:
- Is there a trivial way to speedup the above approach?
- Is there a more elegant way to "hand" or "mouse" define a region of interest in an image and isolate it to generate a final product similar to the output of the above approach?


PlotRangePadding -> 0as well; I am adding it to the answer. If this is incorrect just revert the edit. – Mr.Wizard Aug 06 '13 at 23:23