I want to a show simple vector summation but I don't know how to draw a grid behind the vectors. I am pretty sure I can do it with Mathematica but how?
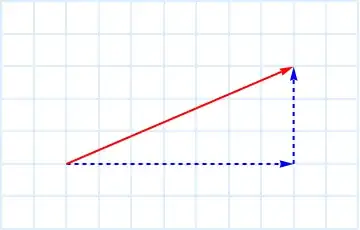
It should look like this:

I want to a show simple vector summation but I don't know how to draw a grid behind the vectors. I am pretty sure I can do it with Mathematica but how?
It should look like this:
Mathematica has lots of Graphics primitives for you to work with, as well as directives such as Thick, Dashed, Red, etc. I'll use Arrow below.
You can specify the value of the GridLines option as a function. Using GridLines -> Range will give lines on a 1:1 grid starting from the extreme lower left of the graphic, as set with PlotRange or determined automatically.
If you want the grid lines to always snap to integer positions, even if the PlotRange is not bounded by integer values, you could use:
GridLines -> (Range[⌊#⌋, ⌈#2⌉]&)
Grid lines on a 2:2 grid can be had with Range[⌊#⌋, ⌈#2⌉, 2] &, etc.
I would construct a function such as this:
draw[a : {x_, y_}, b : {X_, Y_}, opts : OptionsPattern[]] :=
 Graphics[{
    {Thick, Blue, Dashed, Arrow[{a, {X, y}}], Arrow[{{X, y}, b}]},
    {Thick, Red, Arrow[{a, b}]}
   },
   opts,
   GridLines -> (Range[⌊#⌋, ⌈#2⌉]&),
   GridLinesStyle -> Directive[Thick, LightBlue]
 ]
And use it:
draw[{0, 0}, {7, 3}, PlotRangePadding -> 2]
Not included here are the labels that you can add with Text or Inset.
For some explanation of the options handling in the defined function see: Functions with Options
This answer is not intended to be a reference for the use of GridLines, only an illustration of one use: graph paper style. Nevertheless Kuba suggests I mention Method -> {"GridLinesInFront" -> True} and I think that's a good idea. This option draws the grid lines in front of all your graphics except those in the Epilog, if it exists.
draw[{0, 0}, {7, 3}, PlotRangePadding -> 2, Method -> {"GridLinesInFront" -> True}]

See my answer to Changing the background color of the framed region of a plot for an example that uses both "GridLinesInFront" and Epilog.
GridLines works in Graphics
Graphics[{
  {Thick, Darker[Red], Arrow[{{0, 0}, {1, 1}}]},
  {Dashed, Arrow[{{0, 0}, {1, 0}}]},
  {Dashed, Arrow[{{1, 0}, {1, 1}}]},
  Text[Style["R", Italic, Large], {.5, .5}, {0, -1}],
  Text[Style["\[Theta]", Large], {.2, .1}, {-1, 0}]
  }, GridLines -> Automatic, GridLinesStyle -> LightGray,
 PlotRange -> {{-1, 2}, {-.5, 1.5}}, Frame -> True
 ]

PlotRangePadding, which is independent of where the arrows are positioned. :)
– C. E.
Aug 26 '13 at 02:49
PlotRangePadding is a good idea; I hope you don't mind if I incorporate that into my answer.
– Mr.Wizard
Aug 26 '13 at 05:57