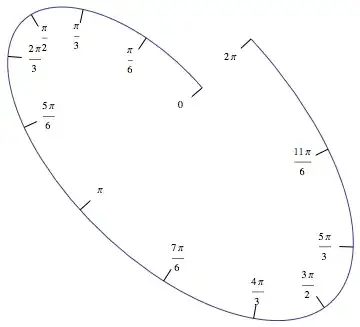
I need to plot ticks with values on the following ParametricPlot[]
The ellipse can be obtained by
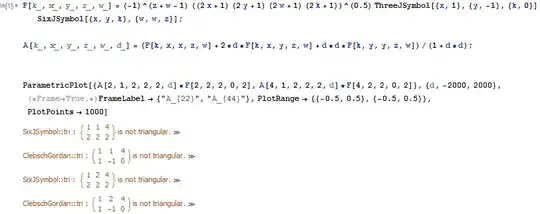
F[k_, x_, y_, z_, w_] = (-1)^(z + w - 1) ((2 x + 1) (2 y + 1) (2 w + 1) (2 k
+ 1))^(0.5) ThreeJSymbol[{x, 1}, {y, -1}, {k, 0}] SixJSymbol[{x, y, k}, {w, w, z}];

A[k_, x_, y_, z_, w_, d_] = (F[k, x, x, z, w] + 2*d*F[k, x, y, z, w] +
d*d*F[k, y, y, z, w])/(1 + d*d);


ParametricPlot[{A[2, 1, 2, 2, 2, d]*F[2, 2, 2, 0, 2],
A[4, 1, 2, 2, 2, d]*F[4, 2, 2, 0, 2]}, {d, -2000,
2000}, (*Frame->True,*) FrameLabel -> {"A_{22}", "A_{44}"},
PlotRange -> {{-0.5, 0.5}, {-0.5, 0.5}}, PlotPoints -> 1000]
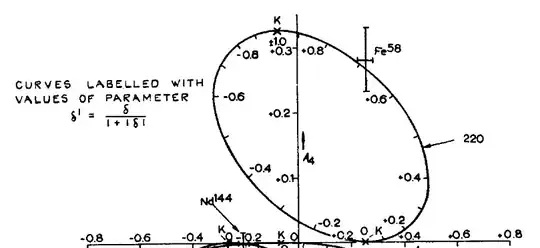
I tried it with Meshpoints, even though I need thicks with the values, and could not even figure this out. As the uploaded pictures says: The curve is labelled with values of the parameter delta' = delta/(1+|delta|). In my case delta is d.
 – Nasser
Aug 30 '13 at 08:15
– Nasser
Aug 30 '13 at 08:15