
I want to change the above colored plot into a grayscale plot. I have tried this:
CCGray[pic_?ImageQ] := Module[{}, ColorConvert[pic, "GrayScale"]];
but it doesn't give me the degree of differentiation I would like.
I want to change the above colored plot into a grayscale plot. I have tried this:
CCGray[pic_?ImageQ] := Module[{}, ColorConvert[pic, "GrayScale"]];
but it doesn't give me the degree of differentiation I would like.
First, there is no need to use Module in your sample code above. You could write simply:
CCGray[pic_?ImageQ] := ColorConvert[pic,"GrayScale"]
Now, if you want to manage the channel mixing manually you can use ImageApply and Dot:
customGray[img_?ImageQ, ker_?VectorQ] := ImageApply[ker.# &, img]

img = Import["https://i.stack.imgur.com/wtlqF.jpg"];

customGray[img, {0.8, 0.5, -0.3}]

You'll notice that my three values add to one; this is typically necessary to preserve white as white. If you want to make this automatic just divide by the total:
customGray2[img_?ImageQ, ker_?VectorQ] := With[{k = ker/Tr@ker}, ImageApply[k.# &, img]]
Or with normalization control as an Option:
Options[customGray2] = {Normalize -> True};

customGray2[img_?ImageQ, ker_?VectorQ, OptionsPattern[]] :=
  With[{k = If[OptionValue[Normalize], ker/Tr@ker, ker]},
    ImageApply[k.# &, img]
  ]
This makes it easy to Manipulate:
Manipulate[
 customGray2[img, {a, b, c}],
 {a, -5, 5}, {b, -5, 5}, {c, -5, 5}
]

Here's an idea to post-process the grayscale image to increase the differentiation between shades. The image values (excluding pure black and white) are fed to HistogramTransformInterpolation which provides a transform function that approximately flattens the image histogram.
bc = BubbleChart[RandomReal[{-1, 1}, {10, 5, 3}]] ~ColorConvert~ "Grayscale"

ImageApply[HistogramTransformInterpolation @
  DeleteCases[ImageData[bc] ~Flatten~ 1, 1. | 0.], bc]

While this seems to work okay on an uncompressed image, it is not so good with the OP's original image due to the jpeg compression:

Better results can be had by removing near-white values from the image data before computing the histogram transform, but there are still visible artefacts.
ImageApply[HistogramTransformInterpolation@
  Select[ImageData[bc]~Flatten~1, 0 < # < 0.95 &], bc]

I assume you've rejected this option:
BubbleChart[RandomReal[{-1, 1}, {10, 5, 3}],
  ColorFunction -> "GrayTones"]
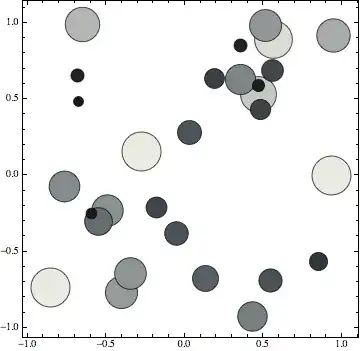
Image is indeed what he wants to do.
– Mr.Wizard
Sep 10 '13 at 18:21
Image -- there is no indication that you were even generating the bubble chart yourself.
– Mr.Wizard
Sep 11 '13 at 12:21