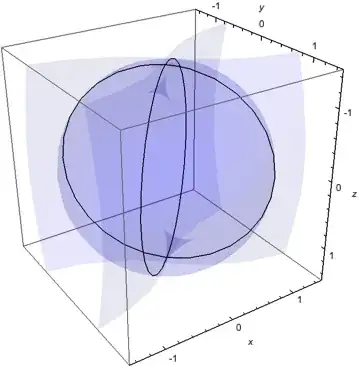
You can use MeshFunctions on one of the plots, adapting the other function for the mesh function.
With[{opts = {BoxRatios -> {1, 1, 1}, AxesLabel -> {"x", "y", "z"},
    PlotRange -> {-1.5, 1.5}, PlotStyle -> Directive[Blue, Opacity[0.1]]}},
 Show[
  SphericalPlot3D[
   Csc[φ], {θ, 0, 2 π}, {φ, 0, π},
   Mesh -> None, opts],
  SphericalPlot3D[Sqrt[2], {θ, 0, 2 π}, {φ, 0, π},
   Mesh -> {{0.}},
   MeshFunctions -> {Function[{x, y, z, θ, φ, r}, 1/r - Sin[φ]]},
   BoundaryStyle -> None, opts]
  ]
 ]
Or, in this case, one could solve explicitly for the intersection (φ equals π/4, 3π/4).
SphericalPlot3D[{Csc[φ], Sqrt[2]},
 {θ, 0, 2 π}, {φ, 0, π},
 BoxRatios -> {1, 1, 1}, AxesLabel -> {"x", "y", "z"},
 Mesh -> {{π/4, 3 π/4}}, MeshFunctions -> {Function[{x, y, z, θ, φ, r}, φ]},
 PlotRange -> {-1.5, 1.5}, PlotStyle -> Directive[Blue, Opacity[0.1]],
 BoundaryStyle -> None]
Sometimes it is necessary to increase PlotPoints to get a smooth mesh line for the intersection.
You can plot the intersection without the surface with the setting PlotStyle -> None.
