As sophomoric as this question seems, how should I save plots in grayscale in Mathematica?
I generally like eps images for their scalability and I use ghostscript or other third party perl scripts to convert my images to grayscale.
As sophomoric as this question seems, how should I save plots in grayscale in Mathematica?
I generally like eps images for their scalability and I use ghostscript or other third party perl scripts to convert my images to grayscale.
One way would be to use ColorConvert to convert the RGB or Hue values to gray scale. Here's an example:
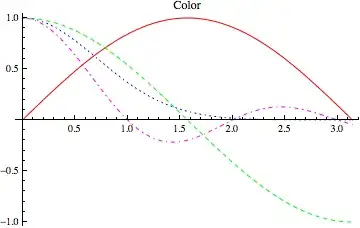
Plot[{Sin[x], Cos[x], Exp[-x^2], Sinc[π x]}, {x, 0, π}] /.
  x : _RGBColor | _Hue | _CMYKColor :> ColorConvert[x, "Grayscale"]


For 2D plots that accept a ColorFunction, you can simply use GrayLevel to get the plot in grayscale as:
DensityPlot[
  Sin[x ^2 + y^2], {x, 0, 3}, {y, 0, 3},
  ColorFunction -> GrayLevel,
  PlotPoints -> 100
]


Typically, these grayscale plots are useful when submitting to journals that charge exorbitant prices just to print in colour. However, just a note of caution that discerning different shades of gray is not easy. For the most effect, it is recommended (at least in the journals I publish in), that you also change the line type for your different curves (and not more than 4 curves/plot). You should also choose the colours (or colourscale, for 2D surface plots) wisely so that they convert well to grayscale. For example:

One way would be to roll your own color functions. For continuous use:
grayScale = Blend[{Black, White}, #1] &

ContourPlot[Sin[x + y], {x, 0, 2 \[Pi]}, {y, 0, \[Pi]},
  ColorFunction -> grayScale]

For discrete plots:
grayColorList = (Blend[{Black, White}, #] & /@ Range[0, 1, 0.1])

Plot[Sin[x], {x, 0, 2 \[Pi]}, PlotStyle -> grayColorList[[1]]]

grayScale function differ from the built-in GrayLevel?
– celtschk
Mar 21 '12 at 16:21
toGrayScale[y_] := y /. x__?(MemberQ[{RGBColor, Hue, CMYKColor}, Head[#]] &) :> ColorConvert[x, "Grayscale"]so that it can be done as an afterthought. e.g.ListLinePlot[RandomReal[{0, 1}, {3, 15, 2}]] // toGrayScale; it works also onContourPlotetc... (not very different from the solution above though !) – chris May 20 '12 at 16:12GrayLevel[], there's alsoColorData["GrayTones"]. – J. M.'s missing motivation Jun 16 '12 at 10:43