11
data = {{0., 0., 0}, {0.12, 0.04, 2}, {0.24, 0.08, 4}, {0.36, 0.11, 
    6}, {0.47, 0.15, 8}, {0.59, 0.19, 10}, {0.71, 0.23, 12}, {0.83, 
    0.26, 14}, {0.95, 0.3, 16}, {1.07, 0.34, 18}, {1.21, 0.38, 
    20}, {1.38, 0.41, 22}, {1.78, 0.45, 24}, {2.84, 0.49, 26}, {3.45, 
    0.52, 28}, {3.88, 0.56, 30}, {4.33, 0.6, 32}, {4.79, 0.64, 
    34}, {5.25, 0.64, 36}, {5.89, 0.3, 38}, {6.16, 0.68, 40}, {6.51, 
    0.84, 42}, {6.89, 0.98, 44}, {7.27, 1.14, 46}, {7.67, 1.39, 
    48}, {8.07, 1.95, 50}, {8.47, 5.3, 52}, {8.89, 5.82, 54}, {9.3, 
    6.14, 56}, {9.71, 6.48, 58}, {10.11, 6.9, 60}, {10.52, 7.56, 
    62}, {10.92, 8.18, 64}, {11.32, 8.55, 66}, {11.72, 8.86, 
    68}, {12.13, 9.16, 70}, {12.53, 9.46, 72}, {12.93, 9.77, 
    74}, {13.33, 10.07, 76}, {13.73, 10.38, 78}};

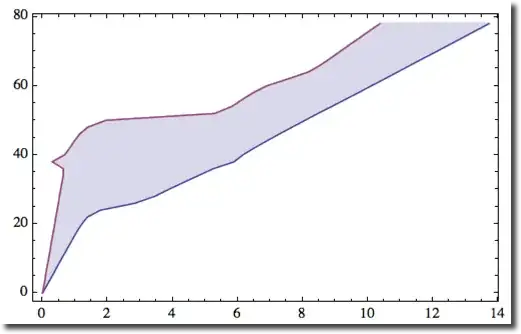
ListLinePlot[data[[;; , {#, 3}]] & /@ {1, 2}, Filling -> {1 -> {2}}, Frame -> 1]

My code gives this

enter image description here

but I want it look like this

enter image description here

expression
  • 5,642
  • 1
  • 19
  • 46

2 Answers2

10
  • Reverse points around y=x axis (flip y-x coordintaes) to get correct filling
  • But now you plot is flipped - so flip again around y=x with GeometricTransformation

Here it is:

pl = ListLinePlot[(Reverse /@ data[[All, {#, 3}]]) & /@ {1, 2}, Filling -> {1 -> {2}}];
Graphics[GeometricTransformation[pl[[1, 2]], ReflectionTransform[{-1, 1}]], Frame -> True, 
 AspectRatio -> 1/GoldenRatio]

enter image description here

Mr.Wizard
  • 271,378
  • 34
  • 587
  • 1,371
Vitaliy Kaurov
  • 73,078
  • 9
  • 204
  • 355
7

I like the solution panda-34 gave in a comment on the question. It is simple and gets the job done

ListLinePlot[data[[;; , {#, 3}]] & /@ {1, 2},
  Filling -> {{1 -> Top}, {2 -> {Top, White}}},
  Frame -> True]

However, if there is some reason why it would be undesirable to have the upper left region of the plot rectangle filled with opaque white, you can get the results you want by appending a data point to the data for the upper curve that extends it to the far right of the plot rectangle but puts it outside the plot range.

Module[{d1, d2},
  {d1, d2} = data[[;; , {#, 3}]] & /@ {1, 2};
  AppendTo[d2, {data[[-1, 1]], 2 + data[[-1, -1]]}];
  ListLinePlot[{d1, d2},
    PlotRange -> {0, data[[-1, -1]]},
    PlotRangePadding -> {.25, 2},
    Filling -> {1 -> {2}},
    Frame -> True]]

Both of the above expressions produce the desired plot when evaluated:

plot.png

m_goldberg
  • 107,779
  • 16
  • 103
  • 257