How do I highlight a single period of a trig function say by using color and/or thickness when the graph itself extends further than just a single period? Thanks...Gregory Lane
Asked
Active
Viewed 532 times
2
-
Just plot a trig function two times, use different styles and ranges (PlotStyle and PlotRange, respectively). To combine two plots use Show function. – Grzegorz Rut Sep 29 '13 at 11:47
2 Answers
11
Plot[Sin[x], {x, -4 Pi, 4 Pi}, Mesh -> {{0, 2 Pi}},
 MeshShading -> {ColorData[1][1], Red}]

Update
[@belisarius pointed out that another answer shows the built-in, but undocumented, function Period`PeriodicFunctionPeriod that returns the period of a periodic function with exact coefficients.]
If you'd like more general functionality, one can write a function to get the period and another to highlight a period from an arbitrary starting point. The pattern in getPeriod parses the typical affine transformations of trigonometric graphs studied in school.
ClearAll[highlightPeriod, getPeriod];
SetAttributes[highlightPeriod, HoldAll];
SetAttributes[getPeriod, HoldAll];

getPeriod[f_, var_] :=
  Periodic`PeriodicFunctionPeriod[Rationalize[f, 0], var];

highlightPeriod[f_, dom_, x0_: 0., opts : OptionsPattern[Plot]] :=
  Block @@
   Join[
    Hold[{dom}] /. {x_, __} :> x,
    Hold[
     Plot[f, dom, Mesh -> {{x0, x0 + getPeriod[f, First@dom]}},
      MeshShading -> (OptionValue[MeshShading] /.
         None -> {ColorData[1][1], Red}), opts]
     ]
    ];
The real key is the two lines of the Plot command. The function definition could consist of just these two lines, but there's a risk. The use of Block is to keep the function and variable in the domain dom from evaluating before being passed to Plot. Without this, if x has been set to a numerical value, then its value and not the symbol would be passed to Plot, which would not work since a number cannot serve as a variable.
Calling highlightPeriod is like calling Plot, except there is an option third argument x0 that specifies the starting point of the highlighted period.
Examples:
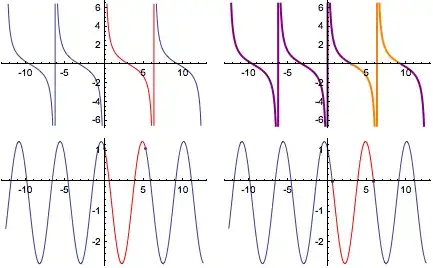
ex1 = highlightPeriod[Cot[x/2], {x, -4 Pi, 4 Pi}];
ex2 = highlightPeriod[Cot[x/2], {x, -4 Pi, 4 Pi}, Pi,
   MeshShading -> {Purple, Orange},  (* change color *)
   MeshStyle -> None,                (* removes mesh dots *)
   PlotStyle -> Thick];
ex3 = highlightPeriod[2 Cos[1.2 x + 0.5] - 0.7, {x, -4 Pi, 4 Pi}];
ex4 = With[{f = 2 Cos[1.2 x + 0.5] - 0.7},
   highlightPeriod[f, {x, -4 Pi, 4 Pi},
    x /. FindRoot[f, {x, 0.}]]       (* start at a zero of f *)
   ];

GraphicsGrid@{
  {ex1, ex2},
  {ex3, ex4}}
The old getPeriod, for reference:
getPeriod[Sin|Cos|Sec|Csc]:=2Pi;
getPeriod[Tan|Cot]:=Pi;
getPeriod[(amp_:1.) f_[(a_:1.) \
x_Symbol+b_:0]+vshift_:0.]/;NumericQ[a]:=getPeriod[f]/a;
Michael E2
- 235,386
- 17
- 334
- 747
-
1Perhaps you could use the answers here http://mathematica.stackexchange.com/q/5852/193 – Dr. belisarius Sep 29 '13 at 15:48
-
5
Here is one way:
Show[Plot[Sin[x], {x, 0, 6 Pi}],
 Plot[Sin[x], {x, 0, 2 Pi},
  PlotStyle -> Directive[Red, Thickness[0.01]]]]
If you want to add interactivity, you can translate the red cycle to the right one cycle (or whatever you choose):
Manipulate[
 Show[Plot[Sin[x], {x, 0, 6 Pi}],
  Plot[Sin[x - j], {x, j, 2 Pi + j},
   PlotStyle -> Directive[Red, Thickness[0.01]]]], {j, 0, 2 Pi}]

ubpdqn
- 60,617
- 3
- 59
- 148