2

I'm trying to get the PlotRange from a ListPlot graphic:

aa = RandomReal[14, {50}] - 40;
bb = RandomReal[140, {50}] - 40;
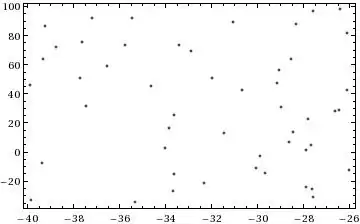
plt = ListPlot[Transpose[{aa, bb}], Frame -> True, Axes -> False,PlotRange -> Automatic]

Result

AbsoluteOptions[plt, PlotRange]
{PlotRange -> {{0., 1.}, {0., 1.}}}

This is clearly wrong, Why?

This happens using version 8.0.0, 64bit under Linux (Fedora).

Andre
  • 21
  • 2
  • 1
    It works for me, can you try with a fresh kernel ? – b.gates.you.know.what Oct 01 '13 at 13:10
  • Can't say why it does this, but if you put PlotRange -> Automatic, it will return the correct plot range. Oh, and with respect to b.g's comment, I have reproduced the issue on Mathematica 9, fresh kernel and all. – jVincent Oct 01 '13 at 13:10
  • @b.gatessucks, a fresh kernel did not change it – Andre Oct 01 '13 at 13:14
  • @jVincent, thanks, but adding PlotRange->Automatic didn't work – Andre Oct 01 '13 at 13:15
  • Interesting, what version are you working on? – jVincent Oct 01 '13 at 13:15
  • Works for me on Mathematica 8.0.4.0 Fedora 19 64bit. – Öskå Oct 01 '13 at 13:24
  • Thanks Öskå, If we see this inconsistent behavior, does this then indicate either a bug or a configuraton issure? – Andre Oct 01 '13 at 13:33
  • It gives the correct range under Mathematica 9.0.1.0 Win 7 64bit, so I guess if this can be reproduced under v9.0.0, than it is the manifestation of the bug discussed here. Flagging as duplicate. – István Zachar Oct 01 '13 at 13:55
  • @ István Zachar, Thanks! I didn't found this one. The question you found clearly answers mine. First, this behavior is a bug and second, there are some published workarounds. – Andre Oct 01 '13 at 14:22

0 Answers0