I want a user friendly window in which to have a menu where you can choose the chart you want to display, in which you can move parameters in order to note the width or height of the chart, but I try to declare a function which call control so that using TraditionalForm displayed as the user can understand it, but it is no longer displayed graph. My question is: How I can do to have a function declared prior to Manipulate plot and also will allow me to move the parameters?
  a = "Algebraicas";
  b = "Trigonometricas";
  c = "Tercer Grado";
  y = w + 1;
  Module[{myPlot}, myPlot[f_] := Plot[f[x], {x, -5, 5}];
        Manipulate[
        myPlot@selection,
        {x, {a, b, c}, ControlType -> PopupMenu},
            {{selection, None}, selChoice, ControlType -> SetterBar},
        {selChoice, Which[
                  x == a, {Sqrt[y] -> TraditionalForm[Sqrt[y]] &, #^2 &},
                  x == b, {#^3 &, Abs@# &},
                  x == c, {Sin, Cos}]}, None}]]
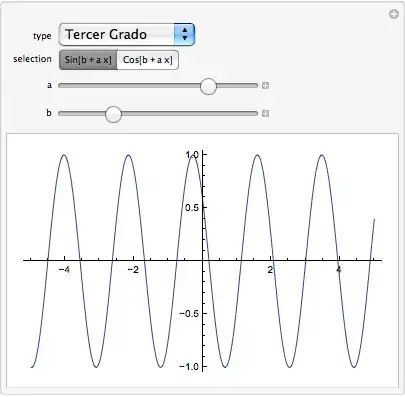
but I need to do is you can move the graph parameters, such as:
Manipulate[Plot[Sin[a x + b], {x, 0, 6}], {a, 1, 4}, {b, 0, 10}]
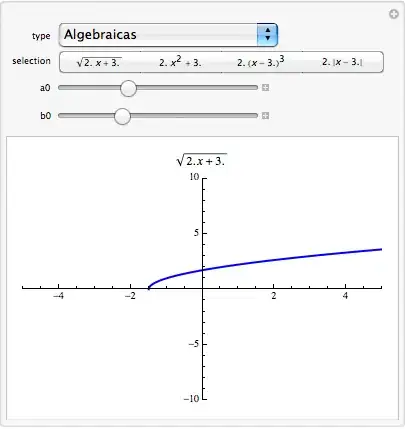
Now I want to have a label on each graph which is observed as the values are updated manipulate the slide, this is the code that I have.
 Clear[a, b, c];
 types = {"Algebraicas", "Logaritmicas y exponenciales",
  "Trigonometricas", "Trigonometricas Inversas", "Hiperbolicas",
  "Hiperbólicas Inversas"};

  Manipulate[
     Plot[
         selection /. {a -> a0, b -> b0}, {x, -5, 5},
         PlotRange -> {{-5, 5}, {-10, 10}}, PlotStyle -> {Blue, Thick},
         PlotLabel -> selection],
 {type, types, ControlType -> PopupMenu},
     {selection, Dynamic[type /.
      Thread[types -> {{Sqrt[a x + b] -> TraditionalForm[Sqrt[a x + b]],
        a x^2 + b, a (x - b)^3, a Abs[x - b]}, {Log[10, 1000],
       Log[E, x], Log[1000.]}, {Sin[a x + b], Cos[a x + b],
       Tan[a x + b]}, {Cot[a x + b], Csc[a x + b],
       Sec[a x + b]}, {"a"}, {"b"}}]],
       ControlType -> SetterBar},
       {{a0, 1, a}, 1, 4}, {{b0, 0, b}, 0, 10}]
This is the new code.
   Clear[Seleccion, tipos, Tipo, selecciones, funciones, a, b, c, d, a0, \
   b0, c0, d0]
   tipos = {"Algebraicas", "Logaritmicas y exponenciales",
   "Trigonometricas", "Trigonometricas Inversas", "Hiperbolicas",
   "Hiperbólicas Inversas"};
   funciones = {{c ( x/d + a) + b, c Sqrt[ x/d + a] + b,
   c ( x/d + a)^2 + b, c (x/d + a)^3 + b, c Abs[x/d + a] + b,
   c/(x/d + a) + b, c/(x/d + a)^2 + b}, {c Log[E, x/d + a],
   c Log[2, x/d + a] + b, c Log[(1/2), x/d + a] + b,
   c Exp[x/d + a] + b, c 2^(x/d + a) + b,
   c (1/2)^(x/d + a) + b}, {c Sin[x/d + a] + b, c Cos[x/d + a] + b,
   c Tan[ x/d + a] + b, c Cot[x/d + a] + b, c Csc[x/d + a] + b,
   c Sec[ x/d + a] + b}, {c ArcSin[ x/d + a] + b,
   c ArcCos[ x/d + a] + b, c ArcTan[ x/d + a] + b,
   c ArcCot[x/d + a] + b, c ArcCsc[x/d + a] + b,
   c ArcSec[ x/d + a] + b}, {c Sinh[x/d + a] + b,
   c Cosh[x/d + a] + b, c Tanh[ x/d + a] + b, c Coth[x/d + a] + b,
   c Csch[x/d + a] + b,
   c Sech[ x/d + a] + b}, {c ArcSinh[ x/d + a] + b,
   c ArcCosh[ x/d + a] + b, c ArcTanh[ x/d + a] + b,
   c ArcCoth[x/d + a] + b, c ArcCsch[x/d + a] + b,
   c ArcSech[ x/d + a] + b}};

   Manipulate[Seleccion = tipos /. Thread[tipos -> funciones[[All, 1]]];
   Dynamic@Plot[
   Seleccion /. {a -> a0, b -> b0, c -> c0, d -> d0}, {x, -5, 5},
   PlotRange -> {{-5, 5}, {-10, 10}}, PlotStyle -> {Orange, Thick},
   PlotLabel ->
   Style [Framed[
   Pane[TraditionalForm[
    Seleccion /. {a -> a0, b -> b0, c -> c0, d -> d0},
    3], {Automatic, 40}]], White, Background -> Lighter[Gray]],
   AxesLabel -> {Style[x, Large, Bold, Blue],
   Style[y, Large, Bold, Blue]},
   LabelStyle -> Directive[Black, Bold], ImageSize -> 540], {Tipo,
   tipos, ControlType -> PopupMenu}, {Seleccion,
   Dynamic[Tipo /.
   Thread[tipos ->
    With[{selecciones = Map[# &, funciones, {2}]}, selecciones]]],
    ControlType -> SetterBar}, {{a0, 0, "a"}, -3, 3}, {{b0, 0, "b"}, -3,
    3}, {{c0, 1, "c"}, -3, 3}, {{d0, 1, "d"}, -3, 3}]