Suppose that I have two plots (e.g., Plot, ListPlot, etc) that cover two regions of space. I would like to display them "stacked" vertically, so that they align nicely in publication-quality form.
Suppose that I am dealing with ListPlot and I have the following data:
xdata = Range[0, 2 Pi, 0.2];
ydata1 = Sin[xdata];
ydata2 = 1 + Sin[xdata];
So for plot1, I will plot Transpose[{xdata, ydata1}]; for plot2, I will plot Transpose[{xdata, ydata2}] (both using ListPlot). Plot1 covers both negative and positive $y$ values, whereas plot2 covers only positive $y$ values; this fact will be important later. For both plots, I will use BaseStyle -> {18, FontFamily -> "Arial"} so that the labels are large and legible. I will also use Frame -> True and will include frame labels with FrameLabel -> {"x (Meter)", "y (Meter)"}.
Now if I do the following...
plot1 = ListPlot[Transpose[{xdata, ydata1}], Frame -> True,
  FrameLabel -> {"x (Meter)", "y (Meter)"},
  BaseStyle -> {18, FontFamily -> "Arial"}, PlotStyle -> Red, ImageSize -> 375]

plot2 = ListPlot[Transpose[{xdata, ydata2}], Frame -> True,
  FrameLabel -> {"x (Meter)", "y (Meter)"},
  BaseStyle -> {18, FontFamily -> "Arial"}, PlotStyle -> Blue, ImageSize -> 375]
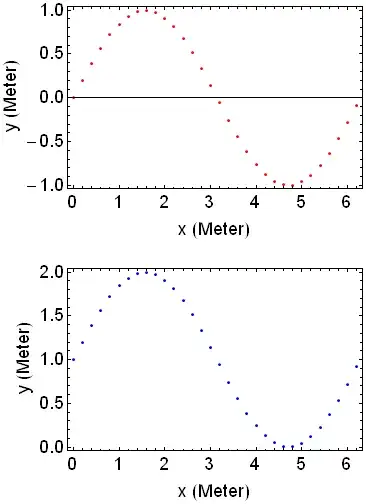
...I get the following...

Notice that above, the frames are not aligned. To fix this, I can specify the same ImagePadding for both plots...
plot1 = ListPlot[Transpose[{xdata, ydata1}], Frame -> True,
  FrameLabel -> {"x (Meter)", "y (Meter)"},
  BaseStyle -> {18, FontFamily -> "Arial"}, PlotStyle -> Red, ImageSize -> 375,
  ImagePadding -> {{70, 10}, {55, 10}}]

plot2 = ListPlot[Transpose[{xdata, ydata2}], Frame -> True,
  FrameLabel -> {"x (Meter)", "y (Meter)"},
  BaseStyle -> {18, FontFamily -> "Arial"}, PlotStyle -> Blue, ImageSize -> 375,
  ImagePadding -> {{70, 10}, {55, 10}}]
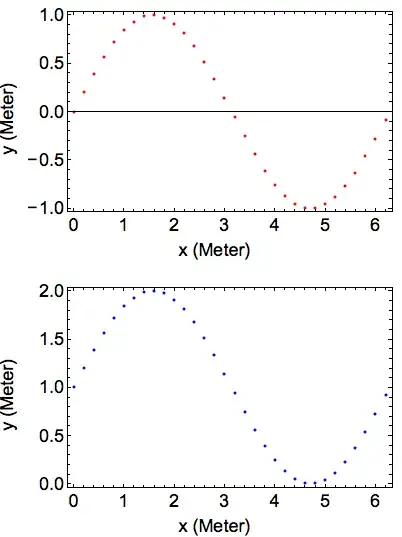
...which gives me the following output...
Now the frames are nicely aligned. However, the $y$ axis frame labels are not aligned. This is because plot1 includes negative $y$ values in addition to positive ones, and the negative signs "push away" the $y$ axis frame label (i.e., "y (Meter)") in plot1.
So, my question is: is it possible to somehow align the $y$ axis frame labels? Apparently, ImagePadding does not do the trick for that particular issue. Thanks for your time.
FrameLabel -> {"x (Meter)", None, None, "y (Meter)"}– BoLe Oct 12 '13 at 18:09FrameTicks -> {Automatic, {{.5, "+\[VeryThinSpace]0.5"}}}. – BoLe Oct 12 '13 at 18:12