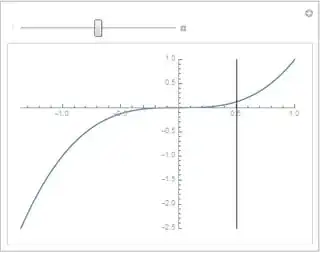
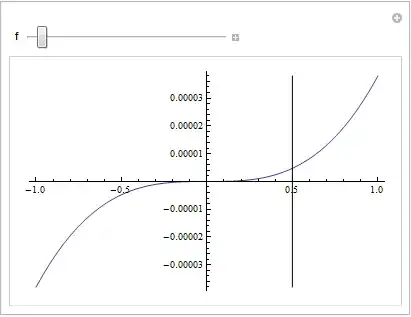
I'm trying to plot a function inside a Manipulate and draw a vertical line at some $x$ position. The scale of the plot can vary a lot depending on the Manipulate settings. Example:
h = 1;
Manipulate[
 Plot[10^f*x^3, {x, -1, 1},
  Epilog -> {Line[{{0.5, -h}, {0.5, h}}]}], {{f, 0}, -5, 5}]
Now the problem is to choose a good value for h: If it's too small, it's not as high as the plot. If it's too large, the line isn't drawn at all. (Sidenote: Don't try to make the line dashed or dotted. Apparently the dashing/dotting is done before the clipping, so Mathematica just freezes up if f gets too small.)
Ideally, I'd just want to draw a line from $y=-\infty \ldots +\infty$. Is there a simple way to do that?


hwith10^fwhich is the maximum of the function you're plotting in the given interval ? – b.gates.you.know.what Oct 14 '13 at 07:38