Update
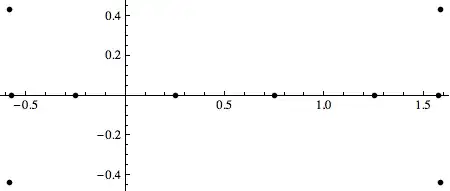
Solve[N[Table[BernoulliB[n, z], {n, 10, 10}] == 0]]
{{z -> -0.5841145496910024` - 0.435309007896589` I}, <<4>>}
I am then finding and replacing z -> with blank to get :
{{-0.5841145496910024` - 0.435309007896589` I}, <<4>>}
I am then finding and replacing ` I} with } to get :
{{-0.5841145496910024`-0.435309007896589}, <<4>>}
I am then finding and replacing ' with , to get :
{{-0.5841145496910024, -0.435309007896589}, <<4>>}
My question is, is there a way of doing this without all of the find & replace business?
Old
I am generating a list from :
Solve[N[Table[BernoulliB[n, z], {n, 100, 100}] == 0]]
And then manually finding and replacing elements in the generated list such as z -> with Blank, then finding and replacing , I} with }, and so on. I am then producing a list plot form the resultant array. Is there a way of automating this process and producing a list plot directly?

I}with},"? – Kuba Oct 17 '13 at 07:06({Re@z, Im@z} /. sol) // ListPlot? – Kuba Oct 17 '13 at 07:28Tablehere? Why not justSolve[N@BernoulliB[10, z] == 0, z]? – murray Oct 17 '13 at 14:33