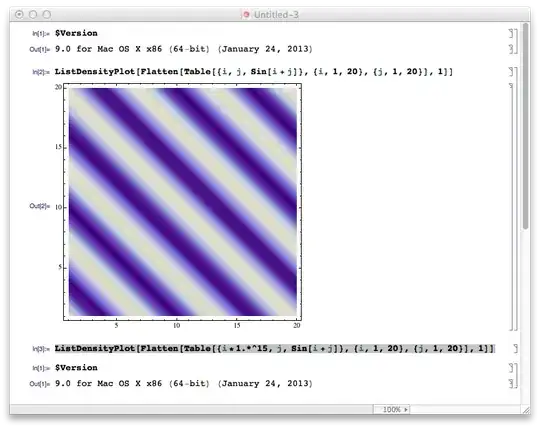
ListDensityPlot[
 Flatten[Table[{i, j, Sin[i + j]}, {i, 1, 20}, {j, 1, 20}], 1]]
gives the expected result, but a linear scale crashes my kernel (please save your work before trying)
ListDensityPlot[
 Flatten[Table[{i*1.*^15, j, Sin[i + j]}, {i, 1, 20}, {j, 1, 20}], 1]]
why? And how to fix it? I'm using OS X 10.9.
Here is the screen crop.
If this is indeed what you want then I see that Mathematica does have a problem trying to generate a density plot with your array. It seems to be handling x-values upto 1.10^5 but from 1.10^6 onwards it is unable to create the plot and crashes.I have alerted the associated development team about this issue and also recorded your contact details in my report. We will keep you posted as and when a resolution becomes available."
– xslittlegrass Oct 30 '13 at 17:42