4

I have several curves on the same parametric 3D plot and I would like to highlight some curves dynamically by choosing them from list.

 sol = Solve[ 2 x + 2 x^2 - 3 x^3 + 26 x^4 + 32 x^5 + 21 x^6 - 18 x^7 == r, {x}];
 lolAux[r_] = x /. sol;
 ParametricPlot3D[
    Table[{r, lolAux[r][[i]] // Re, lolAux[r][[i]] // Im}, {i, 1, Length[sol]}], 
 {r, -5, 5}, BoxRatios -> {1, 1, 1}]

enter image description here

How it is possible?

3 Answers3

2

Another way. ParametricPlot seems to take apart the list of styles passed via PlotStyle, and wrapping each style in Dynamic caused messages and a red-faced plot. So I resort to this hack of putting a special value in as a style, which has to be a valid directive, and replacing it with a Dynamic style.

sol = Solve[2 x + 2 x^2 - 3 x^3 + 26 x^4 + 32 x^5 + 21 x^6 - 18 x^7 == r, {x}];
lolAux[r_] = x /. sol;
curves = Table[{r, lolAux[r][[i]] // Re, lolAux[r][[i]] // Im}, {i, 1, Length[sol]}];
Manipulate[
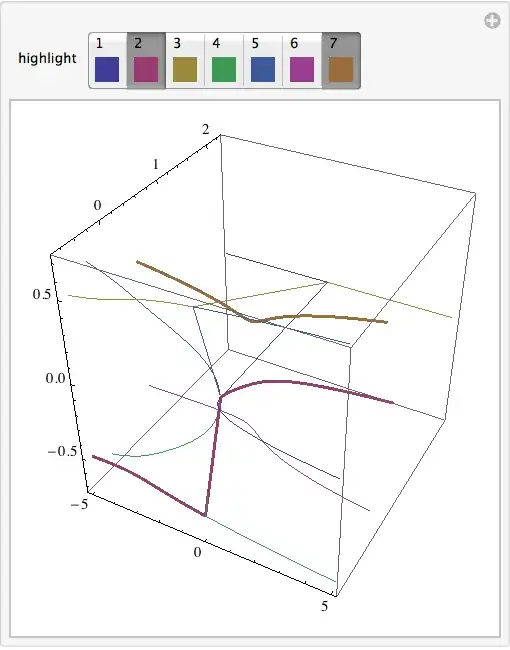
  With[{plot = ParametricPlot3D[curves, {r, -5, 5},
      BoxRatios -> {1, 1, 1}, 
      PlotStyle -> Table[Hue[i/Length@curves], {i, Length@curves}]]},
   plot /. 
    Hue[i_] :> 
     Dynamic @ Directive[ColorData[1][i Length@curves], 
       If[MemberQ[highlight, i Length@curves], Thick, Thin]]
   ],
  {{highlight, {}}, 
   Thread[# ->  Column[{#, Graphics[{}, Background -> ColorData[1][#], ImageSize -> 16]}]] & /@
     Range@Length@curves, TogglerBar}
  ]

Manipulate output

Michael E2
  • 235,386
  • 17
  • 334
  • 747
1

Well, one way to do it is simply using tooltip

sol = Solve[2 x + 2 x^2 - 3 x^3 + 26 x^4 + 32 x^5 + 21 x^6 - 18 x^7 == r, {x}];

lolAux[r_] = x /. sol;

tip = Table[Tooltip[{r, lolAux[r][[i]]//Re, lolAux[r][[i]] // Im}, i], {i, 1, Length[sol]}];

ParametricPlot3D[tip, {r, -5, 5}, BoxRatios -> {1, 1, 1}]

enter image description here

Vitaliy Kaurov
  • 73,078
  • 9
  • 204
  • 355
1

Here's one way. You have to change 2 in Array to the number of functions you're plotting, and also the list of functions that can be selected. The number is their corresponding position in the list of functions.

Array[ColorData[1], 2] generates a list of length two, filled with the colors that Mathematica uses by default for the first two lines in a plot.

Of course you can change the plot style in other ways than just making the line thicker.

Manipulate[
 ParametricPlot3D[
  {{Sin[u], Cos[u], u/10}, 0.5 {Cos[u], Sin[u], u/10}}, {u, 0, 20},
  PlotStyle -> 
   MapAt[{Thick, #} &, Array[ColorData[1], 2], List /@ selected]
  ],
 {{selected, {}}, {1, 2}, CheckboxBar}]

scrn

C. E.
  • 70,533
  • 6
  • 140
  • 264