20

Is there a way to dynamically define a polygon on a plot (I'm working with ListPlot and SmoothDensityHistogram) to select a cluster of interest, and give the positions of those points in the original list of data?

I'd appreciate any help!

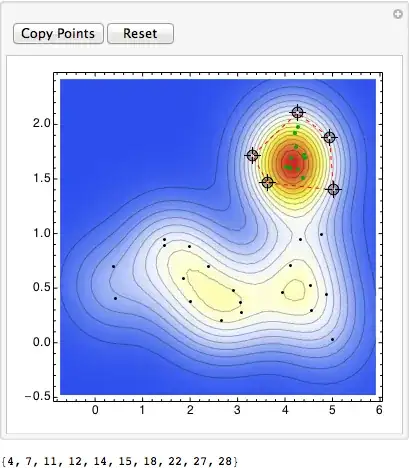
Here's just an example set of points:

x = {
     {RandomReal[{0, 5}, 20],
      RandomReal[{4, 4.5}, 10]},
     {RandomReal[1, 20],
      RandomReal[{1.5, 2}, 10]}
    };

points = Transpose[Join @@@ x] ~RandomSample~ 30;

SmoothDensityHistogram[points, ColorFunction -> "TemperatureMap"]
ListPlot[points, PlotRange -> {{0, 5.5}, {0, 2.5}}]
Mr.Wizard
  • 271,378
  • 34
  • 587
  • 1,371
Daniel S
  • 233
  • 1
  • 8
  • 3
    Press CTRL-D to open the drawing tools, then draw a polygon. Select the polygon, copy it, and paste it back into an input cell to get the vertex coordinates. Then filter the points based on whether they're in the polygon. Someone will probably write a Manipulate with a Paste button to do this automatically. – Szabolcs Mar 27 '12 at 11:40

2 Answers2

19

This is basically the same as what b.gatessucks is doing. The main addition is that I've put all the locators in one list. To add vertices to the polygon you just click somewhere on the graph. I've also added a reset button and a button that prints the indices of the points inside the polygon which makes it easier to copy.

points = RandomSample[
   Transpose[{Flatten[{RandomReal[{0, 5}, 20], RandomReal[{4, 4.5}, 10]}], 
     Flatten[{RandomReal[1, 20], RandomReal[{1.5, 2}, 10]}]}], 30];

winding[poly_, pt_] := Round[(Total @ Mod[(# - RotateRight[#]) &@
  (ArcTan @@ (pt - #) & /@ poly), 2 Pi, -Pi]/2/Pi)]

DynamicModule[{pl, pos},
 pl = SmoothDensityHistogram[points, ColorFunction -> "TemperatureMap"];
 Manipulate[
  pos = Pick[Range[Length[points]], Unitize[winding[poly, #] & /@ points], 1];
  Show[pl, 
   Epilog -> {{Darker[Green], PointSize[Medium], Point[points[[pos]]]},
     {Black, Point[Complement[points, points[[pos]]]]},
     {EdgeForm[{Red, Dashed}], FaceForm[], Polygon[poly]}}],

  {{poly, {}}, Locator, LocatorAutoCreate -> All},
  Row[{Button["Copy Points", Print[pos]], Button["Reset", poly = {}; pos = {}]}]]]

Mathematica graphics

Heike
  • 35,858
  • 3
  • 108
  • 157
  • @Heike I suppose you can also have have a button: Button["Get Polytope Vertices", Print[poly]], which returns the vertices of the polytope you've defined by clicking. – Sparse Pine Jul 27 '13 at 03:54
  • @SparsePine and an "undo" button is also useful, Button["undo", poly = Drop[poly, -1]] – matheorem Dec 11 '13 at 04:39
  • Hi, Heike, Could you please tell me how to change Locator size in manipulate? – matheorem Dec 11 '13 at 06:46
12

Something like (@Szabolcs provided the link to PointInPoly) :

Manipulate[
  Column[{
    Show[ListPlot[points, PlotRange -> {{0, 5.5}, {0, 2.5}}], 
      Graphics[{Pink, Opacity[0.5], Polygon[{p1, p2, p3, p4}]}]], 
    Position[points, #] & /@ Select[points, PointInPoly[#, {p1, p2, p3, p4}] == 1 &]}], 
  {{p1, {0, 0}}, Locator}, 
  {{p2, {3, 1}}, Locator}, 
  {{p3, {1, 1}}, Locator}, 
  {{p4, {2, 1}}, Locator}]

enter image description here

Heike
  • 35,858
  • 3
  • 108
  • 157
b.gates.you.know.what
  • 20,103
  • 2
  • 43
  • 84