I would like to plot a set of points in the same style as ListPlot3D does, but only in a non-convex region that I can specify (e.g. using a RegionFunction). Is there a simple solution for this?
Let me illustrate with an example.
Let's generate some sample points ...
Clear[regionFun]
regionFun[{x_, y_}] := y < x^2

fun[{x_, y_}] := -Norm[{x, y} - {.5, .5}]

pts = Select[Tuples[Range[0, 1, 0.01], 2], regionFun];
... and try to plot then in the region we're interested in:
ListPlot3D[
 Append[#, fun[#]] & /@ pts,
 RegionFunction -> Function[{x, y}, regionFun[{x, y}]],
 InterpolationOrder -> 1
]
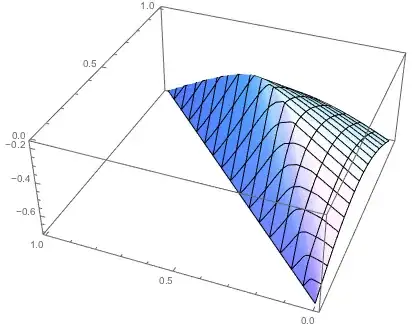
Notice that the plot occupies the complete convex hull of the points because of how the Delaunay triangulation was constructed for the interpolation.
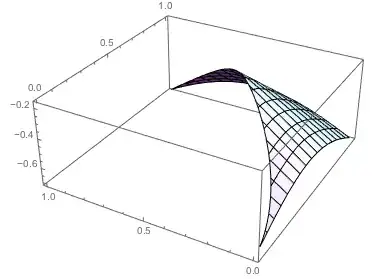
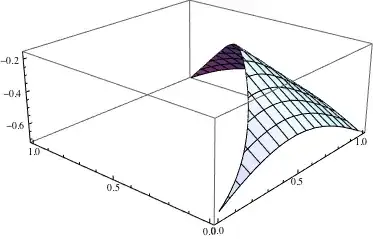
What I would like to see instead is this:
Plot3D[fun[{x, y}], {x, 0, 1}, {y, 0, 1},
 RegionFunction -> Function[{x, y}, regionFun[{x, y}]]]
The only possible solution I see at the moment is to use an external tool to "manually" construct a Delaunay triangulation which is confined within a region and build the plot from that data. This, however, is a lot of work, so I thought I'd ask first if there's a simple solution.
Note that this is just a generated example dataset, not my real data. I can't use Plot3D for my real application, only ListPlot3D and related functions.
Interpolation::udegmessage too!Interpolationorder will be constrained to one. – PlatoManiac Nov 10 '13 at 21:24ifun = Interpolation[Append[#, fun[#]] & /@ pts, InterpolationOrder -> 1, "ExtrapolationHandler" -> {(Indeterminate &), "WarningMessage" -> False}];andMaxRecursion -> 6, I get a plot that's as good as the nativePlot3D. – rm -rf Nov 10 '13 at 21:29List*plotting functions that work on 2D data will only do linear interpolation for unstructured grids, so it's the same thing. – Szabolcs Nov 10 '13 at 21:31{"points" -> ..., "values" -> ...}format, contains a set of points and a set of values to be plotted at each points location. The plotting needs to be done using the transformed{Sqrt[#1], #2}& @@@ points, and the region is anything that falls inside the convex hull of the untransformed points, i.e.Function[{x, y}, inPolygonQ[hull, {x^2, y}]]wherehull = ConvexHull[points].inPolygonQcan be the built-in, undocumented one you can find using?*`InPolygonQ. – Szabolcs Nov 10 '13 at 21:48