Plot[Sin[x^2], {x, 0, 3}, AxesLabel -> {"x value", Sin[x^2]}]
In the above code give a graph. In the graph the axes fonts are too small. My problem is that, how can I enlarge the axes text x and x^2 without changing the basic.
Plot[Sin[x^2], {x, 0, 3}, AxesLabel -> {"x value", Sin[x^2]}]
In the above code give a graph. In the graph the axes fonts are too small. My problem is that, how can I enlarge the axes text x and x^2 without changing the basic.
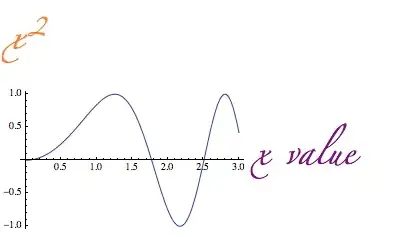
This works:
Plot[Sin[x^2], {x, 0, 3},
 AxesLabel -> {
    Style["x value", Purple, FontFamily -> "Zapfino", FontSize -> 24],
    Style[x^2, Orange, FontFamily -> "Zapfino", FontSize -> 24]
    }]