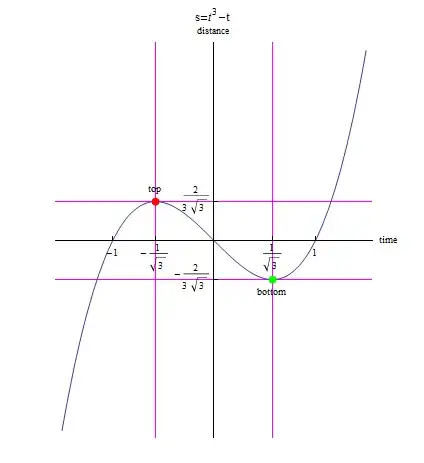
So I saw this picture on my book and it was left as an exercise to figure out.
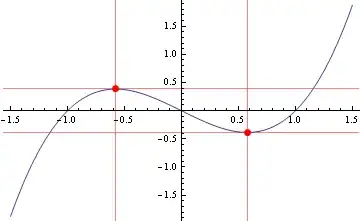
This is what I have so far, but I'm not sure where I went wrong.
Plot[{t^3 - t}, {t, -1, 1}, PlotStyle -> Blue, Exclusions -> {t == 1},Exclusions -> {t == -1}, Exclusions -> {s == 2/(3*Sqrt[3])},Exclusions -> {s == -2/(3*Sqrt[3])}, ExclusionsStyle -> {Pink}]
I think somewhere I should use Epilog for that red dot, but with my original input incorrect, I cannot go any further.

GridLinesinstead ofExclusions... – rm -rf Nov 12 '13 at 23:00Epilog -> {PointSize[Medium], Point[{-1/Sqrt[3], 2/(3 Sqrt[3])}]}.Showwith aListPlotandPlotwould also work – Sos Nov 12 '13 at 23:30