How can I place a mark, like a cross-hair (to suggest "X marks the spot") and a text label associated with it, at a particular position on an image (mine in particular is Colorized)?
Asked
Active
Viewed 1,947 times
3 Answers
14
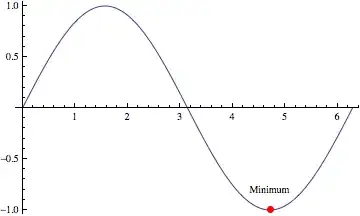
This is a simple way:
Show[
    Plot[Sin[x], {x, 0, 2 \[Pi]}],
    Graphics[{PointSize[Large], Red, Point[{3 \[Pi]/2, -1}],
    Black, Text["Minimum", {3 \[Pi]/2, -.8}]}]]
Edit
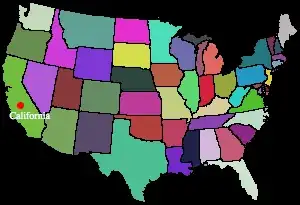
If you have an image created with Colorize you can apply the same method. In the example below img is the image you obtain by taking the first example given in the Help under Colorize.
Show[
   img,
   Graphics[{PointSize[Large], Red, Point[{20, 100}],
   White, Text["California", {30, 90}]}]]
VLC
- 9,818
- 1
- 31
- 60
8
You can also use the Drawing Tools palette to annotate an image interactively. It can be invoked in three ways:
- Selecting
Drawing Toolsfrom theGraphicsmenu - Using the short-cut Ctrl+D or
- Using the right-click context menu on a graphics object:

For a detailed tutorial on the Drawing Tools palette see Interactive Graphics Palette. The following image from the tutorial summarizes the functions in the palette:

Usage example: palette states and before and after appearance of the image using the same image in vucko's answer:

kglr
- 394,356
- 18
- 477
- 896
8
Another approach:
anXtoMarkTheSpot = Graphics[{
  White,
  Line[{{0,10}, {0, -10}}],
  Line[{{-10,0}, {10, 0}}],
  Text[Style["the Spot",14, Bold, White,
      TextAlignment->Left],{20,5}]},
  ImageSize -> 80];

treasureMap = Colorize[ExampleData[{"TestImage", "Aerial2"}]];

ImageCompose[treasureMap, anXtoMarkTheSpot, {60,40}]

cormullion
- 24,243
- 4
- 64
- 133
Colorizeand this givesRaster data contains 0 values per pixel; 3 or 4 are required with ColorFunction->RGBColor, even though it displays fine without the text. – Emre Mar 30 '12 at 18:34