I'm slightly new to the world of Mathematica, so I can't assess the difficulty of my request, but anyhow, this is my question:
I have 2 datasets that I want to plot with two y axes, and a reversed x axis. (as to 'why do you want a reversed x-axis': the time parameter is in thousand years before present, which decreases in value as time moves forward, such that 0 is the present day)
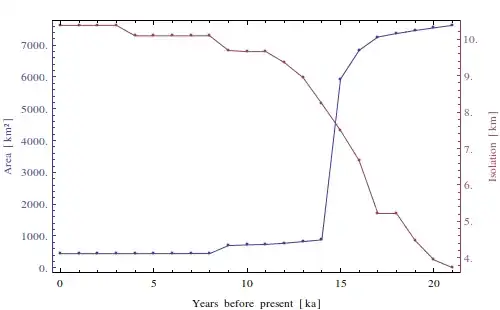
The data is the following:
area = {{0, 443.387}, {1, 443.387}, {2, 443.387}, {3, 443.387}, {4,
 443.387}, {5, 444.06}, {6, 445.406}, {7, 446.751}, {8, 447.424}, {9,
 698.385}, {10, 718.57}, {11, 734.044}, {12, 772.395}, {13,
 822.856}, {14, 878.7}, {15, 5933.58}, {16, 6837.85}, {17,
 7254.32}, {18, 7362.65}, {19, 7458.86}, {20, 7540.94}, {21,
 7621.01}}                    ;
distance = {{0, 10.3807}, {1, 10.3807}, {2, 10.3807}, {3, 10.3807}, {4,
 10.0923}, {5, 10.0923}, {6, 10.0923}, {7, 10.0923}, {8,
 10.0923}, {9, 9.69003}, {10, 9.65897}, {11, 9.65897}, {12,
 9.35579}, {13, 8.94344}, {14, 8.22982}, {15, 7.4932}, {16,
 6.66484}, {17, 5.21611}, {18, 5.21611}, {19, 4.47083}, {20,
 3.94395}, {21, 3.72562}}     ;
I made a YY-plot code using this code: https://mathematica.stackexchange.com/a/647/11219, which produces:
And then reversed the original data using the code as found here: https://mathematica.stackexchange.com/a/5717/11219, which should reverse both the data and the axis ticks.

As I hope you can see: the data is transformed correctly, the labels on the x-axis are not. So in combining the two codes I found, I broke the Ticks on the x-axis. Is it possible to fix this? Even a manual setting of the labels is fine with me, all my plots have the same data range from 21--0. The current code is:
TwoAxisListLinePlot[{f_, g_}] :=
 Module[{fgraph, ggraph, frange, grange, fticks,
   gticks}, {fgraph, ggraph} =
   MapIndexed[
    ListLinePlot[#, Axes -> True, PlotStyle -> ColorData[1][#2[[1]]],
      Mesh -> Full,
      Ticks -> ({Transpose[({#[[1]],
                Reverse@#[[2]], #[[3]], #[[4]]} &@
              Transpose[Sort@#[[1, 2, 1]]])], #[[1, 2, 2]]} &@
         AbsoluteOptions[ListLinePlot@#1, Ticks])
      ] &, {f, g}]; {frange, grange} =
   Last[PlotRange /. AbsoluteOptions[#, PlotRange]] & /@ {fgraph, ggraph};
  fticks =
   Last[Ticks /.
      AbsoluteOptions[fgraph,
       Ticks]] /. _RGBColor | _GrayLevel | _Hue :> ColorData[1][1];
  gticks = (MapAt[Function[r, Rescale[r, grange, frange]], #, {1}] & /@
       Last[Ticks /.
        AbsoluteOptions[ggraph,
         Ticks]]) /. _RGBColor | _GrayLevel | _Hue -> ColorData[1][2];
  Show[fgraph,
   ggraph /.
    Graphics[graph_, s___] :>
     Graphics[
      GeometricTransformation[graph,
       RescalingTransform[{{0, 1}, grange}, {{0, 1}, frange}]], s],
   Axes -> False, Frame -> True,
   FrameStyle -> {ColorData[1] /@ {1, 2}, {Automatic, Automatic}},
   FrameLabel -> {"Years before present [ka]", "Area [km\.b2]", "",
     "Isolation [km]"},
   FrameTicks -> {{fticks, gticks}, {Automatic, Automatic}}]]
And then run as
k1 = Transpose@({Reverse[#[[1]]], #[[2]]} &@Transpose@area);
k2 = Transpose@({Reverse[#[[1]]], #[[2]]} &@Transpose@distance);
TwoAxisListLinePlot[{k1, k2}]

TicksandFrameTicks. I'll be glad to help if you get stuck. – Mr.Wizard Dec 19 '13 at 08:27Which did the trick. Thanks for the help!
– Erik Dec 21 '13 at 12:01