You can use Accounting to do this. It has the options available.
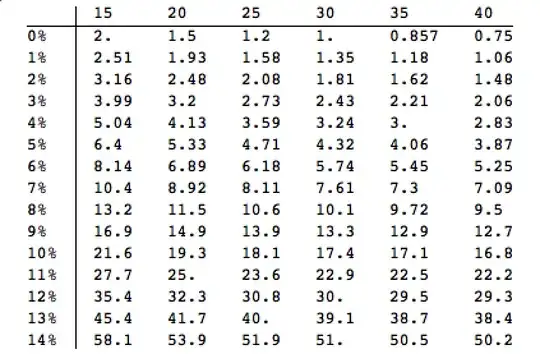
a[r_, n_, d_] := (((1 + r)^n) - 1)/(1 - (1 + r)^-d)
padIt[v_?(Element[#, Reals] &), f_List] :=
AccountingForm[v, f, NumberSigns -> {"-", "+"},
NumberPadding -> {"0", "0"}, SignPadding -> True];
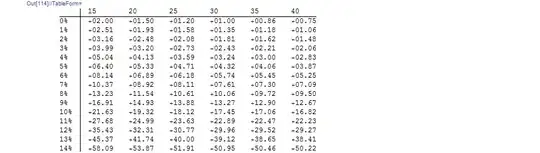
TableForm[
Table[padIt[a[r, 30, d], {3, 2}], {r, .000000000001, .15, .01}, {d,15, 40, 5}],
TableHeadings -> {{"0%", "1%", "2%", "3%", "4%", "5%", "6%", "7%",
"8%", "9%", "10%", "11%", "12%", "13%", "14%"}, {"15", "20", "25",
"30", "35", "40"}}]

If you do want exact size of columns, with the sign there, use {4, 2} instead of {3,2} in the call above
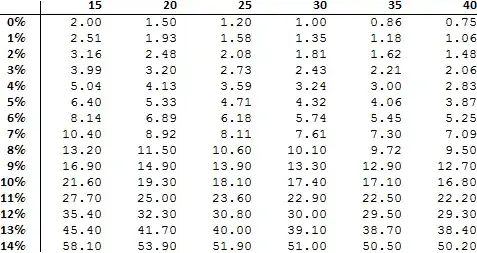
If you do not want the sign at all, use NumberSigns -> {"", ""} instead and to get the same output as excel, use
padIt[v_?(Element[#, Reals] &), f_List] :=
  AccountingForm[v, f, NumberSigns -> {"", ""},
   NumberPadding -> {" ", "0"}, SignPadding -> False];
TableForm[
 Table[padIt[a[r, 30, d], {4, 2}], {r, .000000000001, .15, .01}, {d,15, 40, 5}],
 TableHeadings -> {{"0%", "1%", "2%", "3%", "4%", "5%", "6%", "7%",
    "8%", "9%", "10%", "11%", "12%", "13%", "14%"}, {"15", "20", "25",
     "30", "35", "40"}}]

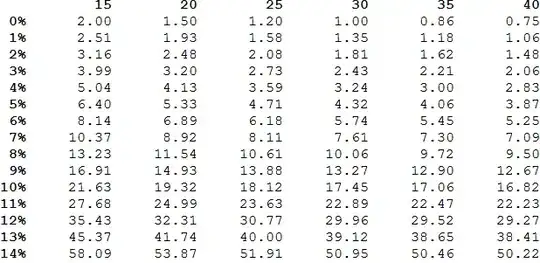
And If you want to left-justify the columns, use
padIt[v_?(Element[#, Reals] &), f_List] :=
  AccountingForm[v, f, NumberSigns -> {"", ""},
   NumberPadding -> {" ", "0"}, SignPadding -> False];

TableForm[
 Table[padIt[a[r, 30, d], {3, 2}], {r, .000000000001, .15, .01}, {d,15, 40, 5}],
 TableHeadings -> {{"0%", "1%", "2%", "3%", "4%", "5%", "6%", "7%",
    "8%", "9%", "10%", "11%", "12%", "13%", "14%"}, {"15", "20", "25",
     "30", "35", "40"}}]

and finally, if you do not want space in the columns, you can use
padIt[v_?(Element[#, Reals] &), f_List] :=
  AccountingForm[v, f, NumberSigns -> {"", ""},
   NumberPadding -> {"0", "0"}, SignPadding -> False];
TableForm[
 Table[padIt[a[r, 30, d], {4, 2}], {r, .000000000001, .15, .01}, {d, 15, 40, 5}],
 TableHeadings -> {{"0%", "1%", "2%", "3%", "4%", "5%", "6%", "7%",
    "8%", "9%", "10%", "11%", "12%", "13%", "14%"}, {"15", "20", "25",
     "30", "35", "40"}}]