14

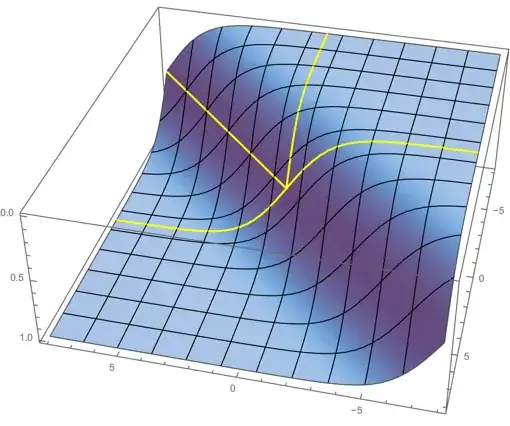
How can I add lines that demarcate the different regions of the following 3D plot:

Plot3D[1/(1 + E^(-a - c)), {a, -8, 8}, {c, -8, 8}]

To give you an idea of what I have in mind I have added the lines and descriptions in the 3D plot in paint; now I want to know how to do it directly in Mathematica.

enter image description here

rm -rf
  • 88,781
  • 21
  • 293
  • 472
Guest
  • 143
  • 5

1 Answers1

18

MeshFunctions are generally quite useful for making such demarcations:

With[{d = {Thick, Yellow}},
    Plot3D[1/(1 + E^(-a - c)), {a, -8, 8}, {c, -8, 8}, PlotPoints -> 50, 
        MeshStyle -> {Black, Black, d, d, d}, Mesh -> {10, 10, {0}, {0}, {0}}, 
        MeshFunctions -> {# &, #2 &, # &, If[# <= 0, # + #2] &, If[# <= 0, #2] &}
    ]
]

rm -rf
  • 88,781
  • 21
  • 293
  • 472
  • 1
    I was working on MeshFunctions too, but couldn't get the function definitions quite right. Didn't know that the If's without second argument could work here. – Sjoerd C. de Vries Dec 26 '13 at 00:06
  • @SjoerdC.deVries I'm not sure that they do. Try permuting the order of the mesh functions. When one If returns a Null, mesh functions later in the list are messed up. – Michael E2 Dec 26 '13 at 04:13
  • Thanks for the reply!

    Sorry for crossposting (I did not anticipate that you would be so quick and effective in replying!)

    – Guest Dec 26 '13 at 08:14