Referring to this page,
Plotting implicitly-defined space curves
How can I project the curves of intersection onto the x-y plane?
Referring to this page,
Plotting implicitly-defined space curves
How can I project the curves of intersection onto the x-y plane?
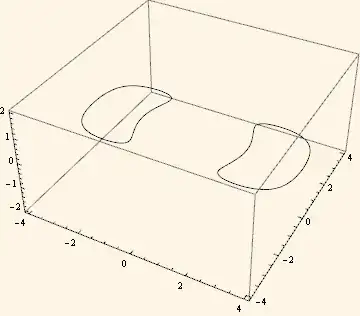
Using the example from Plotting implicitly-defined space curves
ContourPlot3D[(x^2 + y^2 + z^2 + 8)^2 == 36 (x^2 + y^2), {x, -4,
   4}, {y, -4, 4}, {z, -2, 2},
  MeshFunctions -> {Function[{x, y, z}, y^2 + (z - 2)^2 - 4]},
  Mesh -> {{0}}, ContourStyle -> None, PlotPoints -> 30,
  BoxRatios -> Automatic] /. {x_Real, y_Real, z_Real} -> {x, y, 0}
The same as David Park's answer but with 2D output
cp3d = ContourPlot3D[(x^2 + y^2 + z^2 + 8)^2 ==
    36 (x^2 + y^2), {x, -4, 4}, {y, -4, 4}, {z, -2, 2},
   MeshFunctions -> {Function[{x, y, z}, y^2 + (z - 2)^2 - 4]},
   Mesh -> {{0}}, ContourStyle -> None, PlotPoints -> 30,
   BoxRatios -> Automatic];

Graphics[Cases[cp3d, GraphicsComplex[p___, OptionsPattern[]] :>
   (GraphicsComplex[p] /. {x_Real, y_Real, z_Real} :> {x, y})], Axes -> True]

ViewPoint -> {0, 0, \[Infinity]}, ViewVertical -> {0, 1, 0}, Ticks -> {True, True, None}, I suppose it is a duplicate but I can't find a good link :). Also, maybe it is not, you want 3D or 2D plot as an output? – Kuba Dec 29 '13 at 15:31