3

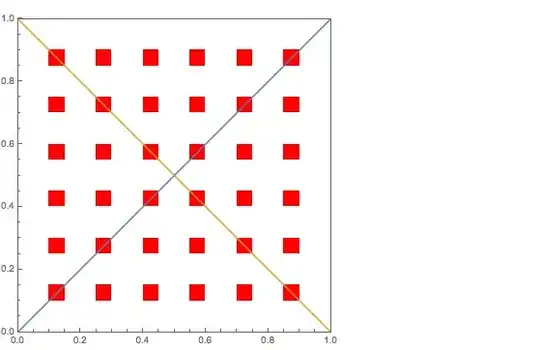
I am trying to figure out how to align different types of plots into one image. For example in the following code, it plots two lines on top of a MatrixPlot. I want the lines to pass through the corners of the red squares in the overlaid image.

 Overlay[{
     MatrixPlot[Table[Mod[i^2 + j^2, 3], {i, 20}, {j, 20}], 
         ColorRules -> {0 -> Red, 1 -> White, 2 -> White}, AspectRatio -> Full],
     Plot[{y = x, y = -x/1 + 1}, {x, 0, 1}, AspectRatio -> Full]}, 
     ImageSize -> Full]

How can I create the image so the lines and squares fit together better?

rm -rf
  • 88,781
  • 21
  • 293
  • 472
spaceKnot
  • 383
  • 1
  • 8

2 Answers2

5

When you overlay two plots like that, you need to make sure that both plots have the same AspectRatio, PlotRangePadding and ImagePadding. It also improves the clarity if you turn off the ticks for one of the plots:

With[{opts = {AspectRatio -> 1, PlotRangePadding -> 0, ImagePadding -> 18}}, 
    Overlay[{
        MatrixPlot[Table[Mod[i^2 + j^2, 3], {i, 20}, {j, 20}], 
            ColorRules -> {0 -> Red, 1 -> White, 2 -> White}, opts, FrameTicks -> False], 
        Plot[{y = x, y = -x/1 + 1}, {x, 0, 1}, opts]}, ImageSize -> Full
    ]
]

I've eyeballed the ImagePadding here, and you will have to adjust it if you change the font size or include frame labels. You can also use different paddings for each side.

For a more robust and automated solution, you can use this answer by Heike to retrieve the image padding of both plots and set them both to the maximum padding as I did in this answer.

rm -rf
  • 88,781
  • 21
  • 293
  • 472
1

You also could just place them in the same coordinate system. That opens few other ways.

MatrixPlot[Table[Mod[i^2 + j^2, 3], {i, 20}, {j, 20}], 
 ColorRules -> {0 -> Red, 1 -> White, 2 -> White},
 AspectRatio -> 1, PlotRangePadding -> 0, Epilog -> {
   {Orange, Line[{{0, 0}, {20, 20}}]},
   {Green, Line[{{0, 20}, {20, 0}}]}}]

or...

Show[
 MatrixPlot[Table[Mod[i^2 + j^2, 3], {i, 20}, {j, 20}], 
  ColorRules -> {0 -> Red, 1 -> White, 2 -> White}],
 Plot[{y = x, y = 20 - x}, {x, 0, 20}],
 AspectRatio -> 1, PlotRangePadding -> 0]

...

Vitaliy Kaurov
  • 73,078
  • 9
  • 204
  • 355