2
H[t_] = {{0, 1}, {1, t}};
tmax=5;
fun[X_?ArrayQ, t_] := -I (H[t].X - X.H[t]);

sol = NDSolve[{σ'[t] == fun[σ[t], t], σ[0] == 
Table[If[i == 1 \[And] j == 1, 1, 0], {i, 1, 2}, {j, 1, 
  2}]}, σ[t], {t, 0, tmax}]

Flatten[Evaluate[σ[t] /. sol /. {t -> tmax/100}], 1] // MatrixForm

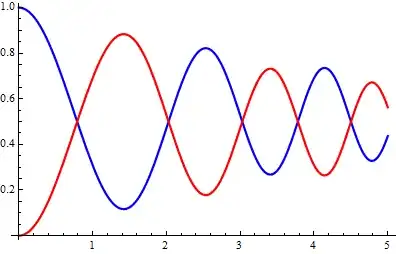
 Plot[Table[Flatten[Evaluate[σ[t] /. sol], 1][[i, i]], {i, 1, 2}], {t, 0,tmax}, PlotRange -> All]

Table plot

How to change the color of two lines in plot... and why

Flatten[Evaluate[σ[t] /. sol], 1][[1, 1]] 

gives

t

while

 Flatten[Evaluate[σ[t] /. sol], 1][[2, 2]] 

gives

 {InterpolatingFuction[{{0.,5.}},<>}[t]}[[2,2]]
C. E.
  • 70,533
  • 6
  • 140
  • 264
santosh
  • 603
  • 3
  • 11

2 Answers2

3

You need to evaluate the data series separately. E.g.

Plot[{
  Flatten[σ[t] /. sol, 1][[1, 1]],
  Flatten[σ[t] /. sol, 1][[2, 2]]},
 {t, 0, tmax}, PlotRange -> All]

enter image description here

See here for explanation. (Your data is in an unevaluated form within Plot.)

Addendum

For the second part of your question, you have this :-

Flatten[Evaluate[σ[t] /. sol], 1][[1, 1]]

t

Presumably you want the curve data: Evaluate is unnecessary, but you need values for t, i.e.

ListPlot[Table[
  Flatten[σ[t] /. sol, 1][[1, 1]],
  {t, 0, tmax, 0.1}], PlotRange -> All]

enter image description here

Further to OP's comment

While using Plot would be ideal for automatic x-axis (t) sample intervals - i.e. more dense where y changes more rapidly - a suitable solution using the original function is to use a sample interval of 0.01 in Table and use ListPlot or ListLinePlot:-

ListLinePlot[Table[
  Flatten[σ[t] /. sol, 1][[i, i]],
  {i, 1, 2}, {t, 0, tmax, 0.01}],
 PlotRange -> All, PlotStyle -> {Red, Green}]

enter image description here

Chris Degnen
  • 30,927
  • 2
  • 54
  • 108
2

Using the solutions you have derived:

y[x_] := Diagonal[\[Sigma][t] /. sol /. t -> x];
u[x_] := Chop[y[x][[1]]]
v[x_] := Chop[y[x][[2]]]

Then plotting:

Plot[{u[t], v[t]}, {t, 0, 5}, 
 PlotStyle -> {{Thick, Blue}, {Thick, Red}}]

gives:

enter image description here

ubpdqn
  • 60,617
  • 3
  • 59
  • 148
  • Thanks for your answer. For my First question...if number of evaluated functions are very large means {i,1,n}, where n considers as 20 then its very inconvenient to write in your way... – santosh Jan 05 '14 at 20:14
  • Also consider H[t] is 20 x 20 matrix... – santosh Jan 05 '14 at 23:17
  • @santosh Sorry for too narrow focus. I agree for larger systems this would be very invonvenient. In that case I would tabulete the results and use ListPlot. You could still use Diagonal to extract diagonal elements of matrix but that is up to you. – ubpdqn Jan 06 '14 at 02:33
  • Is it possible to only evaluate Diagonal element inside the NDsolve to make it faster? something like...sol = NDSolve[{σ'[t] == fun[σ[t], t], σ[0] == Table[If[i == 1 [And] j == 1, 1, 0], {i, 1, 2}, {j, 1, 2}]}, Diagonal[σ[t]], {t, 0, tmax},DependentVariables-> σ[t]] – santosh Jan 06 '14 at 23:29