3

I want to make and image/dashborad (to export to PDF) with many VERTICAL bullet graphs gauges. And I can´t make it, in a automatic way.

In general, the questions are:

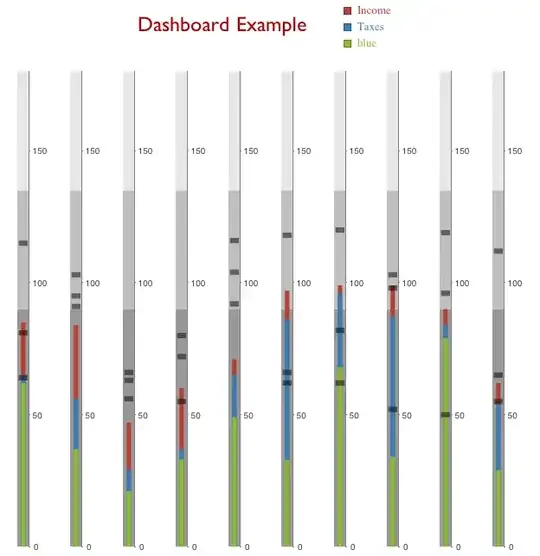
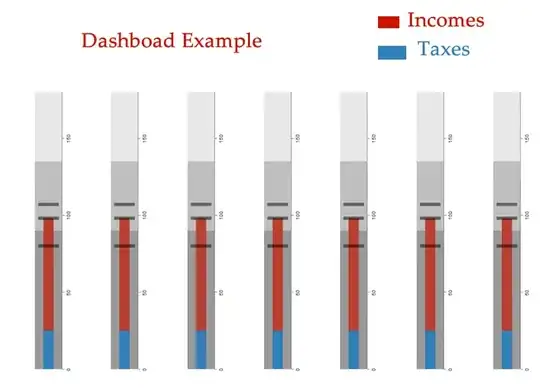
QUESTION 1: How to make a dashboard similar to this one:

enter image description here

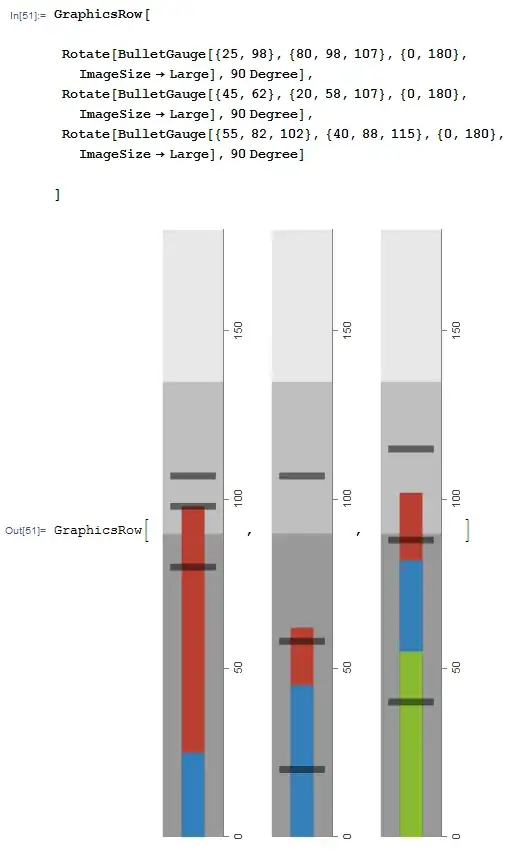
For example, with only 3 gauges, I write this code:

GraphicsRow[
 Rotate[BulletGauge[{25, 98}, {80, 98, 107}, {0, 180}, 
   ImageSize -> Large], 90 Degree],
 Rotate[BulletGauge[{45, 62}, {20, 58, 107}, {0, 180}, 
   ImageSize -> Large], 90 Degree],
 Rotate[BulletGauge[{55, 82, 102}, {40, 88, 115}, {0, 180}, 
   ImageSize -> Large], 90 Degree]
 ]

and the result is:

enter image description here

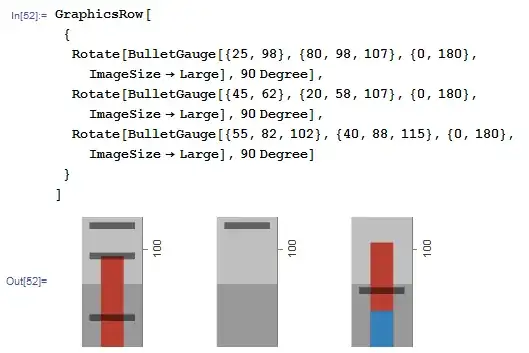
I modified the code and put "{ }" to separate the 3 graphs, to obtain no commas between graphs, and the text "Graph..." and the brackets... but the result is so strange to me, because I can only view a little piece of the graphs.

QUESTION 2: Is this normal? How could I make my user view the entire graphs as in the previous image (without commas and "graph.." and brackets)?.

enter image description here

QUESTION 3: How I can rotate the text marks "0", "50", "150"... ?

Another way might be make automatic this individual bullet graphs, and find all I need in a PDF with LATEX, or in a similar way.

What are the best options for achieving all these things?

VividD
  • 3,660
  • 4
  • 26
  • 42
Mika Ike
  • 3,241
  • 1
  • 23
  • 38

1 Answers1

11

For your purpose, you better use Row instead of GraphicsRow (Rotate[graphics..] is no longer graphics anyway). There is no option to set rotation of gauge tick but you could hack(?) to do that. I wrote a little function to rotate gauge and tick:

rotate[gauge_] := 
 Rotate[gauge /. Text[l_, r__] :> Text[Rotate[l, 270 Degree], r], 
  90 Degree]

rotate[BulletGauge[{25, 98}, {80, 98, 107}, {0, 180}, 
  ImageSize -> Large]]

enter image description here

Here's the result with Row:

color = {RGBColor[0.73`, 0.24506099999999992`, 0.1971`], 
   RGBColor[0.1971`, 0.5022473119339774`, 0.73`], 
   RGBColor[0.5356156238679548`, 0.73`, 0.1971`]};
Labeled[Row[
  rotate /@ {BulletGauge[{25, 98}, {80, 98, 107}, {0, 180}, 
     ImageSize -> Large], 
    BulletGauge[{45, 62}, {20, 58, 107}, {0, 180}, 
     ImageSize -> Large], 
    BulletGauge[{55, 82, 102}, {40, 88, 115}, {0, 180}, 
     ImageSize -> Large]}, Spacer[20]], 
 Row[{Style["Dashboard Example", "Subtitle", Darker[Red]], 
   SwatchLegend[color, 
    Thread[Style[{"Income", "Taxes", "blue"}, color]]]}, 
  Spacer[30]], Top]

enter image description here

Here's the code that scale gauge (but if you need very specific gauge, you might need to construct one by yourself and it could be easier than modifying built in one).

scaleRotate[g_, sc_: 1] := 
 rotate[Graphics[
   GeometricTransformation[g[[1]], ScalingTransform[{1, sc}]], 
   ImagePadding -> {{2, 2}, {15, 2}}, g[[2]]]]

Example:

color = {RGBColor[0.73`, 0.24506099999999992`, 0.1971`], 
   RGBColor[0.1971`, 0.5022473119339774`, 0.73`], 
   RGBColor[0.5356156238679548`, 0.73`, 0.1971`]};
Labeled[Row[
  scaleRotate[#, .25] & /@ 
   Table[BulletGauge[RandomInteger[{20, 100}, 3], 
     RandomInteger[{50, 120}, 3], {0, 180}, 
     ImageSize -> Large], {10}], Spacer[2]], 
 Row[{Style["Dashboard Example", "Subtitle", Darker[Red]], 
   SwatchLegend[color, 
    Thread[Style[{"Income", "Taxes", "blue"}, color]]]}, 
  Spacer[30]], Top]

enter image description here

halmir
  • 15,082
  • 37
  • 53