4

I noticed that the scaling of bubbles in the BubbleChart function depends on the y position of a bubble.

Compare these two examples.

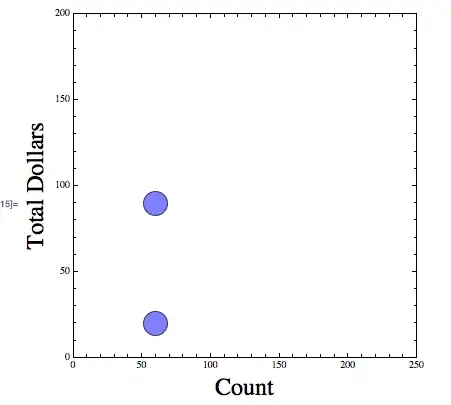
BubbleChart[{{60.0, 20.0, 50.0}, {60.0, 90.0, 50.0}}, 
 FrameLabel -> {Style["Count", 24], Style["Total Dollars", 24]}, 
 BubbleScale -> "Diameter", PlotRange -> {{0, 250}, {0, 200}}, 
 ImageSize -> {400, 400}]

Bubble chart with small bubbles

BubbleChart[{{60.0, 20.0, 50.0}, {60.0, 120.0, 50.0}}, 
 FrameLabel -> {Style["Count", 24], Style["Total Dollars", 24]}, 
 BubbleScale -> "Diameter", PlotRange -> {{0, 250}, {0, 200}}, 
 ImageSize -> {400, 400}]

Bubble chart with large bubbles

The only difference is the y coordinate. But the bubble size changes.

Any ideas?

Oleksandr R.
  • 23,023
  • 4
  • 87
  • 125
Jeff Lapides
  • 263
  • 2
  • 6
  • I vaguely recall that the size of the bubble is a fraction of the bounding box of all bubbles, including those outside the PlotRange. You can achieve control by placing two small bubbles, one at the bottom-left and one at top-right of your PlotRange AND make sure you filter your data so there is nothing outside of this before you plot it. – Ymareth Jan 16 '14 at 18:51
  • That makes sense based on what I am seeing. I'll give it a try.

    Thanks much, Jeff

    – Jeff Lapides Jan 16 '14 at 23:04
  • @Ymareth If you have figured it out, please consider posting an answer :) – Kuba Apr 24 '14 at 18:23

1 Answers1

2

Introducing two small bubbles, at the minimum and maximum of the plot range (there must be no data points outside of the plot range) alleviates this problem a bit.

BubbleChart[{{{60.0,20.0,50.0},{60.0,120.0,50.0}},{{0,0,1},{250,200,1}}},
    ChartStyle->{Blue,Directive[White, EdgeForm[White]]},
    FrameLabel->{Style["Count",24],Style["Total Dollars",24]},
    BubbleScale->"Diameter",PlotRange->{{0,250},{0,200}},
    ImageSize->{400,400}]

Removing the ChartStyle option will reveal the two "helper" bubbles.

Ymareth
  • 4,741
  • 20
  • 28
  • Back when I was working on this, I tried that but it failed to give me adequate control. I ended writing my own bubble chart code to solve the problem – Jeff Lapides Apr 28 '14 at 13:09
  • Its been a while since I used it. I found it "awkward" but for my purposes adequate - then again I wasn't doing anything dynamic. I think many of the newer chart functions are a bit raw in V9 and hope they have fewer rough edges in V10. – Ymareth Apr 28 '14 at 15:49