I am new to Mathematica and I tried searching the docs but no specific examples there.
This is what I have achieved so far, returns an error, probably wrong syntax.
Plot[ Sin[x], {x, 0, 2 Pi}, Filling -> Range {x, 0, Pi}]
I am new to Mathematica and I tried searching the docs but no specific examples there.
This is what I have achieved so far, returns an error, probably wrong syntax.
Plot[ Sin[x], {x, 0, 2 Pi}, Filling -> Range {x, 0, Pi}]
No, there is no "special function that allows me to integrate and in the process, it does the shade", but you can shade the area and plot the points used in the integration. For example:
f[x_?NumericQ] := Sow[{x, Sin[x]}][[2]]
{#[[1]], Plot[f@x, {x, 0, Pi}, Epilog -> Point@#[[2]],
              Filling -> Axis]} &@Reap@NIntegrate[f[x], {x, 0, Pi}]

Integrate[Sin[x], x]. You may benefit from reading the documentation for Integrate, perhaps start here: How to Do an Integral
– Simon Woods
Jan 20 '14 at 17:08
I don't really understand the question but you can try this:
Manipulate[Plot[{Sin[x], Sin[x] Boole[x < y]}, {x, 0, Pi},
    Filling -> 2 -> Axis, Frame -> True,
    ImageSize -> 500, Epilog -> Inset[NIntegrate[Sin[x],
      {x, 0, y}], {y, 1/2 Sin[y]}, {Right, Center}]], {y, 0, Pi}
]
Taking the question at face value: you can calculate the area of the fill from the Graphics object that is generated by Plot, specifically the Polygon expression.
I will use this fill method and my old polyarea code.
The plot:
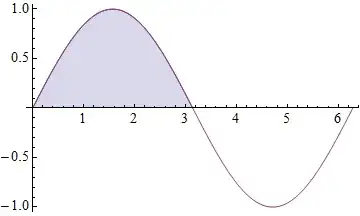
gr = Plot[{If[x < Pi, Sin[x]], Sin[x]}, {x, 0, 2 Pi}, Filling -> {1 -> Axis}]
The area:
polyarea =
  Compile[{{v, _Real, 2}},
   Block[{x, y}, {x, y} = Transpose@v;
    Abs[x.RotateLeft@y - RotateLeft@x.y]/2]];

Cases[Normal @ gr, Polygon[a_?ArrayQ] :> polyarea[a], {-4}]
{1.99894}
Normal is needed to convert the GraphicsComplex data into plain coordinate data.
Additional Plot precision will yield additional numeric precision:
gr = Plot[{If[x < Pi, Sin[x]], Sin[x]}, {x, 0, 2 Pi},
      Filling -> {1 -> Axis},
      Method -> {MaxBend -> 0.5}];

Cases[Normal @ gr, Polygon[a_?ArrayQ] :> polyarea[a], {-4}]
{1.99998}
For a function that crosses the axis you will need to account for the sign. For example:
Plot[Re[Zeta[1/2 + I t]], {t, -7, 20}, Filling -> Axis, Method -> {MaxBend -> 0.2}]

Cases[Normal @ %, Polygon[a_?ArrayQ] :> Sign@Last@Mean@a * polyarea@a, {-4}]

Total @ %

{-0.00312878, -1.15988, 7.2798, 3.74814, 11.4189}21.2838
Confirmation of the area calculated with NIntegrate:
NIntegrate[Re[Zeta[1/2 + I t]], {t, -7, 20}]
21.2838
Plot[{If[0 < x < Pi, Sin[x]], Sin[x]}, {x, 0, 2 Pi}, Filling -> {1 -> Axis}]For area take a look atIntegrate. – Kuba Jan 20 '14 at 14:53Integrate[Sin[x], {x, 0, Pi}]– bill s Jan 20 '14 at 14:55