2

I would like to make a plot where the points of ListPointPlot3D are themselves a Graphics3D object created using SphericalPlot3D, and each one depends on the position of the point. So basically, you have a list of points, {x, y, z}, and at each point there is a graphic which is determined by a function $f(x_i, y_i, z_i)$. I have been searching for about a day now to try and find a solution to this with no luck. Any help is greatly appreciated.

Also, I don't have to use ListPointPlot3D, and if there is a better method I would certainly welcome it.
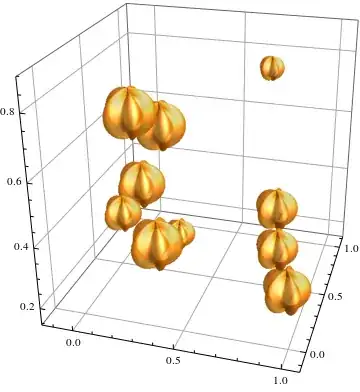
MarcoB
  • 67,153
  • 18
  • 91
  • 189
Michael Ray
  • 133
  • 4

2 Answers2

4

You can also try using BubbleChart3D along with the ChartElements option. For example:

element = 
 SphericalPlot3D[
  1 + Sin[5 \[Phi]]/5, {\[Theta], 0, Pi}, {\[Phi], 0, 2 Pi}, 
  PlotStyle -> 
   Directive[Orange, Opacity[0.7], Specularity[White, 10]], 
  Mesh -> None, PlotPoints -> 30, Boxed -> False, Axes -> None];

BubbleChart3D[RandomReal[1,{10,4}], ChartElements->element]

enter image description here

The caveat here will be that BubbleChart3D expects data in the form of {x,y,z,u}, wehre u will be used to determine the size of the "bubble". If you don't care about that just set them all equal to 1 or something.

chuy
  • 11,205
  • 28
  • 48
2

Let's make some 3D object to use as the point. I'm lazy so I lifted this from the docs:

obj = First@SphericalPlot3D[1 + 2 Cos[2 θ], {θ, 0, Pi}, {ϕ, 0, 2 Pi}];

(It's important that this object should be centred around the origin $(0,0,0)$.)

Generate points:

pts = RandomReal[20, {10, 3}];

Use Translate to place the object at the positions of the points:

Graphics3D@Translate[obj, pts]

enter image description here

Szabolcs
  • 234,956
  • 30
  • 623
  • 1,263