1
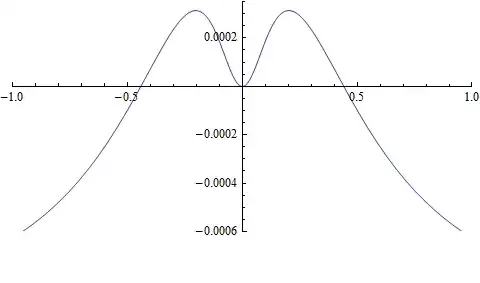
f[k_] = {{-0.001 - 2 I k, 1, -0.001, -0.501}, {0.001, -0.5 - I k, 0.001, 0.001},
         {-0.001, -0.501, -0.001 + 2 I k, 1.}, {0.001, 0.001, 0.001, -0.5 + I k}};

x[k_] = Re[Eigenvalues[f[k]][[3]]];
Plot[x[k], {k, -1, 1}]
ParametricPlot[{k, x[k]}, {k, -1, 1}]

Why does Plot give a result, but ParametricPlot does not? Both functions are supposed to give the graph of the function x[k]. I don't understand why ParametricPlot returns nothing. Please help me to get the difference.

Artes
  • 57,212
  • 12
  • 157
  • 245

1 Answers1

3
Plot[x[k], {k, -1, 1}]

Mathematica graphics

For the ParametricPlot you need to alter the Options to reproduce the plot.

ParametricPlot[{k, x[k]}, {k, -1, 1}, AspectRatio -> 1/2]

You can find out the default AspectRatio for Plot by doing:

Options[Plot, AspectRatio]

{AspectRatio -> 1/GoldenRatio}

Mathematica graphics

OR more elegantly as suggested by Belisarius

p = Plot[x[k], {k, -1, 1}];
ParametricPlot[{k, x[k]}, {k, -1, 1}, Evaluate[AbsoluteOptions[p]]]
RunnyKine
  • 33,088
  • 3
  • 109
  • 176