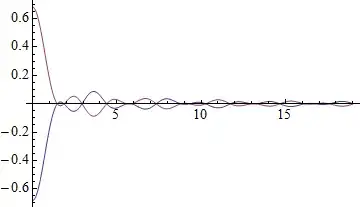
I plotted m[t], but actually what I want to plot is g[t], which is a summation of m[t] from 0 to 19 seconds. But when I plot g[t], I get dots. On the picture, what I want is on the right, I don't want the dots, so I guess list plot is not the way to go. How should I plot g to look like the picture I have to the right;

EDIT
My code;
period = 1;
beta = 0.05;
An = List[{-1 , 1, -1, +1, -1, 1, -1, -1, 1, -1, 1, 1, 1, -1, 1, 1, -1, 1, -1, -1}];
sinch[t_] := (Sin[(Pit - tperiod)/period])/(Pi* t);

m[t_] :=
  An * sinch[t] * (Cos[(Pibetat - t*period) / period] /
    (1 - (4beta^2  (t - t*period)^2 )/period^2 ));
Plot[{m[t]}, {t , 0, 19}]
g = Sum[m[t], {t, 1, 20}];
ListPlot[g]
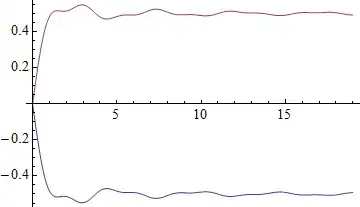
Suminstead ofsum? – ybeltukov Jan 29 '14 at 20:03m[t]asm[t_] := sinch[t]*(Cos[(Pi*beta*t - t*period)/ period]/(1 - (4*beta^2*(t - t*period)^2)/period^2));, then the plotPlot[m[t], {t, 0, 19}]looks very much like what you show on the right of the image shown in your question – m_goldberg Jan 30 '14 at 03:08Total[m[t], 2]is almost zero everywhere. TryPlot[Total[m[t], 2], {t, 0, 19}]to see it – Dr. belisarius Jan 30 '14 at 04:03