I've been working on a project where I need to make two Plots. Those plots are of the form:
Plot[
   NIntegrate[f[x],{x,0,r}],
   {r,0,1}
   ]
Plot[
   NIntegrate[-f[x],{x,0,r}],
   {r,0,1}
   ]
Indeed one of the plots is just the minus the other and I'm wasting computational time doing both the numerical integrals. I then thought that I could create a list of the values of the first plot and then plot that list. Here's what I did:
s = {};
Plot[
Last[Last[
s = Append[s, {r, NIntegrate[f[x], {x, 0, r}]}]
]],
{r, 0, 2}]
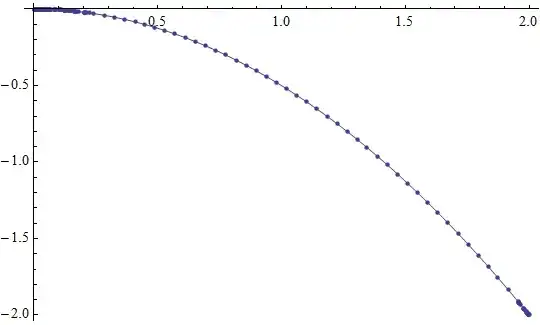
ListLinePlot[s/. {x_, y_} -> {x, -y}]
This however doesn't work the way I wanted. The problem is that aside the values given by NIntegrate[f[x],{...}] there are other values in the list s. Let me present a working example. Consider that the the function that I'm integrating is f[x]=x. Substituting in my code I get the following values for the list s:
{{0.0000408571, 8.34653*10^-10}, {4.08163*10^-8,
  8.32986*10^-16}, {0.0392573, 0.000770569}, {0.0818167,
  0.00334699}, {0.121556, 0.0073879}, {0.160515,
  0.0128826}, {0.202777, 0.0205592}, {0.242218, 0.0293348}, {0.284962,
   0.0406016}, {0.326926, 0.0534402}, {0.366069,
  0.0670033}, {0.408515, 0.0834422}, {0.44814, 0.100415}, {0.486986,
  0.118578}, {0.529134, 0.139991}, {0.568461, 0.161574}, {0.611091,
  0.186716}, {0.652941, 0.213166}, {0.691971, 0.239412}, {0.734303,
  0.2696}, {0.773815, 0.299394}, {0.816628, 0.333441}, {0.858662,
  0.368651}, {0.897876, 0.403091}, {0.940392, 0.442169}, {0.980088,
  0.480286}, {1.019, 0.519184}, {1.06122, 0.563096}, {1.10062,
  0.605682}, {1.14332, 0.65359}, {1.18524, 0.702397}, {1.22434,
  0.749505}, {1.26674, 0.802319}, {1.30632, 0.853242}, {1.34513,
  0.904683}, {1.38723, 0.962206}, {1.42652, 1.01747}, {1.4691,
  1.07913}, {1.50887, 1.13834}, {1.54785, 1.19793}, {1.59014,
  1.26428}, {1.62961, 1.32782}, {1.67238, 1.39843}, {1.71437,
  1.46954}, {1.75354, 1.53745}, {1.79601, 1.61283}, {1.83567,
  1.68484}, {1.87454, 1.75695}, {1.91671, 1.8369}, {1.95607,
  1.9131}, {2., 2.}, {0.0196287, 0.000192643}, {0.060537,
  0.00183237}, {0.101686, 0.00517005}, {0.141036,
  0.00994551}, {0.181646, 0.0164977}, {0.222498, 0.0247526}, {1.97803,
   1.95631}, {0.00981436, 0.0000481608}, {0.0498972,
  0.00124486}, {0.0917515, 0.00420917}, {0.131296,
  0.00861927}, {0.171081, 0.0146343}, {0.212637, 0.0226073}, {1.96705,
   1.93465}, {0.029443, 0.000433445}, {0.0711769,
  0.00253307}, {0.111621, 0.00622962}, {0.150775,
  0.0113666}, {1.98902, 1.97809}, {0.0049072,
  0.0000120403}, {0.0445772, 0.000993565}, {0.0867841,
  0.00376574}, {0.126426, 0.00799173}, {0.165798,
  0.0137445}, {0.207707, 0.0215711}, {1.96156, 1.92386}, {0.0245358,
  0.000301004}, {0.0658569, 0.00216857}, {0.106654,
  0.0056875}, {0.145905, 0.0106442}, {1.98353, 1.96719}, {0.0147215,
  0.000108362}, {0.0552171, 0.00152446}, {0.0343502,
  0.000589967}, {1.99451, 1.98903}, {0.00245362,
  3.01013*10^-6}, {0.0419173, 0.000878529}, {0.0843004,
  0.00355328}, {0.123991, 0.00768685}, {0.163157, 0.01331}, {0.205242,
   0.0210621}, {1.95881, 1.91848}, {0.0220823,
  0.000243813}, {0.063197, 0.00199693}, {0.10417,
  0.00542569}, {0.143471, 0.0102919}, {1.98078, 1.96174}, {0.0122679,
  0.0000752512}, {0.0525571, 0.00138113}, {0.0318966,
  0.000508696}, {1.99176, 1.98356}, {0.00736078,
  0.0000270905}, {0.0269894, 0.000364214}, {0.0171751,
  0.000147492}, {1.99725, 1.99451}, {0.00122683,
  7.52557*10^-7}, {0.0405873, 0.000823665}, {0.0830586,
  0.00344936}, {0.122773, 0.00753664}, {0.161836,
  0.0130954}, {0.204009, 0.0208099}, {1.95744, 1.91579}, {0.0208555,
  0.000217475}, {0.061867, 0.00191376}, {0.102928,
  0.0052971}, {0.142253, 0.010118}, {1.97941, 1.95903}, {0.0110412,
  0.0000609535}, {0.0512272, 0.00131211}, {0.0306698,
  0.000470318}, {1.99039, 1.98083}, {0.00613399,
  0.0000188129}, {0.0257626, 0.000331857}, {0.0159483,
  0.000127174}, {1.99588, 1.99177}, {0.00368041,
  6.77271*10^-6}, {0.0134947, 0.0000910539}, {0.00858757,
  0.0000368732}, {1.99863, 1.99726}, {0.000613436,
  1.88152*10^-7}, {0.0399223, 0.000796896}, {0.0824376,
  0.00339798}, {0.122165, 0.00746208}, {0.161176,
  0.0129888}, {0.203393, 0.0206844}, {1.95676, 1.91445}, {0.0202421,
  0.000204871}, {0.061202, 0.00187284}, {0.102307,
  0.00523338}, {0.141644, 0.0100316}, {1.97872, 1.95767}, {0.0104278,
  0.0000543691}, {0.0505622, 0.00127827}, {0.0300564,
  0.000451694}, {1.9897, 1.97946}, {0.0055206,
  0.0000152385}, {0.0251492, 0.000316242}, {0.0153349,
  0.00011758}, {1.99519, 1.9904}, {0.00306702,
  4.70329*10^-6}, {0.0128813, 0.0000829644}, {0.00797418,
  0.0000317937}, {1.99794, 1.99588}, {0.00184023,
  1.69322*10^-6}, {0.00674739, 0.0000227636}, {0.00429381,
  9.21838*10^-6}, {1.99931, 1.99863}}
So after the first digit of the list of lists reaches $2$ - the plot ranges from $r=0$ to $r=2$ - the list has other values... What am I doing wrong?


...[[1,1,2][r]]? – PML Feb 03 '14 at 19:13NDSolvereturns the solution with structure:{{g->InterpolatingFunction[{{0.,1.}},<>]}}. Part[[1, 1, 2]]just extracts theInterpolatingFunctionand[r]passes the variableras an argument to it. ThenPlot[<...>,{r,0,1}]can make a plot of theInterpolatingFunctionas function ofr. – Alexey Popkov Feb 03 '14 at 20:28